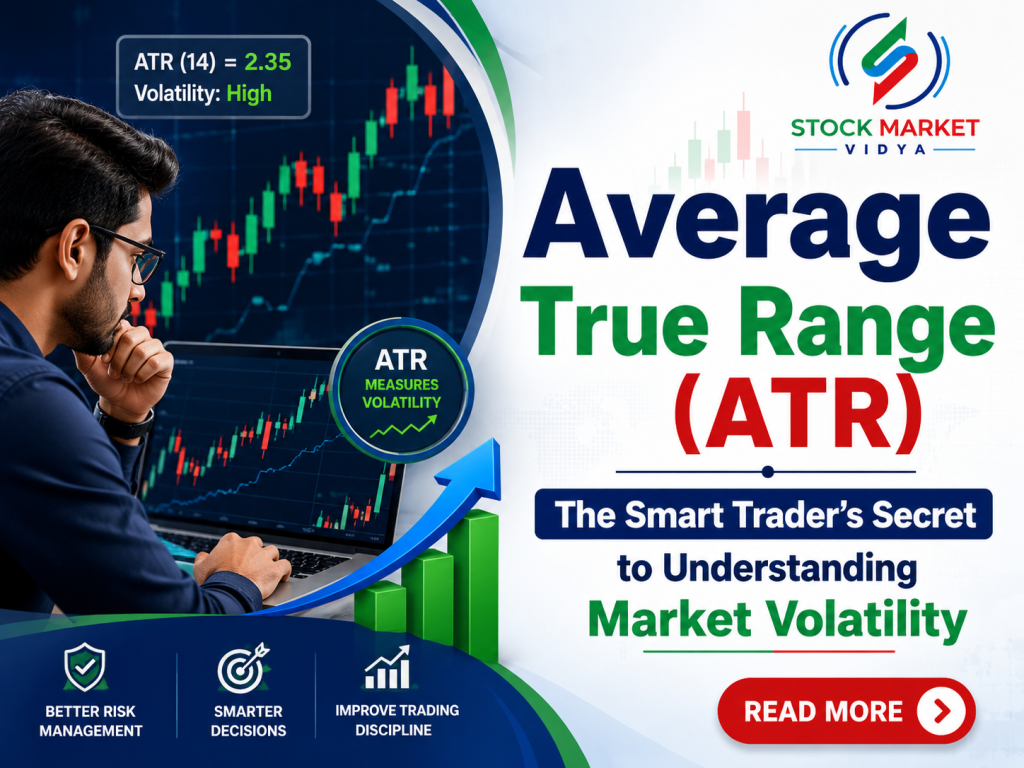

In the stock market, many traders focus only on price movement. Some watch candlestick patterns, while others only look for buy and sell signals. But professional traders know one important truth — understanding market volatility is equally important for successful trading.
This is where the Average True Range (ATR) indicator becomes very useful.
ATR helps traders understand how much a stock or index is moving during a specific period. It does not tell whether the market will go up or down, but it tells how strongly the price is moving. This simple information can improve stop loss placement, position sizing, risk management, and trading discipline.
Today, many successful traders use ATR as an important part of their trading system because it helps them avoid emotional trading decisions.
If you are learning trading and want to build strong practical knowledge, understanding ATR is essential. At Stock Market Vidya, one of the leading share market learning institutes in Nagpur, students are taught practical trading concepts in a simple and easy-to-understand way by Prashant Sarode.
Whether you are a beginner or an intermediate trader, this guide will help you understand ATR in a simple Indian English style.
What is Average True Range (ATR)?
Average True Range, commonly called ATR, is a technical indicator developed by J. Welles Wilder Jr..
ATR measures market volatility.
In simple words, ATR tells traders how much the price of a stock, commodity, or index moves on average during a certain time period.
If ATR is high:
- Market volatility is high
- Price swings are bigger
- Risk and opportunity both increase
If ATR is low:
- Market movement is slow
- Price swings are smaller
- Market may be consolidating
ATR does not indicate trend direction. It only measures movement strength.
Understanding ATR with a Simple Example
Suppose a stock usually moves ₹5 per day.
Suddenly, the stock starts moving ₹15 or ₹20 daily.
This means volatility has increased.
ATR captures this change and helps traders understand current market conditions.
For example:
- ATR value of 2 means the stock moves approximately ₹2 daily
- ATR value of 20 means the stock moves approximately ₹20 daily
This information is extremely useful while setting stop loss and target levels.
ATR Formula Explained Simply
The ATR calculation is based on something called True Range.
True Range measures the greatest among:
- Current High minus Current Low
- Current High minus Previous Close
- Current Low minus Previous Close
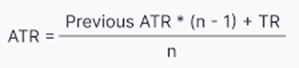
After calculating True Range for several candles, the average is taken.
Most traders use a 14-period ATR.
The basic ATR concept can be represented as:
You do not need to manually calculate ATR because trading platforms automatically show it.

Why ATR is Important in Trading
Many beginners enter trades without understanding volatility.
This creates problems like:
- Very small stop loss
- Emotional exits
- Poor risk management
- Overtrading
- Fear during big market moves
ATR helps solve these problems.
Professional traders use ATR because it helps create discipline.
ATR Helps Traders Set Smart Stop Loss
One of the biggest mistakes beginners make is placing random stop losses.
Sometimes traders keep stop loss too tight and get exited early.
Sometimes they keep very wide stop loss and take huge losses.
ATR solves this issue.
For example:
- If ATR is 10 points, keeping stop loss at only 2 points may not work
- Market naturally moves more than that
Many traders use:
- 1 ATR stop loss
- 1.5 ATR stop loss
- 2 ATR stop loss
This helps traders adjust stop loss according to market volatility.
ATR Helps in Position Sizing
Risk management is the foundation of successful trading.
Suppose two stocks:
- Stock A ATR = 2
- Stock B ATR = 20
Both stocks cannot be traded with the same quantity because volatility is different.
Higher ATR stocks require smaller position sizes.
Lower ATR stocks may allow larger positions.
This is how professional traders protect capital.
At Stock Market Vidya Nagpur, students learn how indicators like ATR are practically used for risk management and position sizing in real market conditions.
ATR and Trading Psychology
Trading is not only about charts.
Mindset plays a huge role in trading success.
When traders do not understand volatility:
- They panic during fast movements
- They exit trades emotionally
- They lose confidence
ATR helps traders stay mentally prepared.
For example:
If you know Nifty usually moves 200 points daily based on ATR, then a 50-point movement will not create panic.
This improves trading discipline.
This is why ATR is not just a technical indicator — it is also a psychological support tool.
Best ATR Settings for Beginners
Most traders use:
- 14-period ATR
This setting works well for:
- Intraday trading
- Swing trading
- Positional trading
Some traders adjust settings:
- 7 ATR for faster signals
- 21 ATR for smoother volatility analysis
Beginners should start with 14 ATR because it provides balanced results.
How to Use ATR in Intraday Trading
ATR is very popular among intraday traders.
Intraday trading requires:
- Quick decision making
- Proper stop loss
- Volatility understanding
ATR helps traders identify:
- Which stocks are moving strongly
- Which stocks are slow
- Best stop loss levels
For example:
If Bank Nifty ATR is high, traders know the market may experience large movements.
This helps them avoid emotional decisions.
Students learning at StockMarketVidya.com are trained to understand such practical market behavior instead of depending only on tips or random indicators.
ATR in Swing Trading
Swing traders hold trades for multiple days.
ATR becomes very useful because overnight volatility can affect trades.
Swing traders use ATR to:
- Decide entry points
- Place logical stop losses
- Estimate possible target range
For example:
If a stock ATR is ₹25, expecting a ₹100 move in one day may not be realistic.
ATR creates practical expectations.
ATR Breakout Strategy
Many traders use ATR for breakout trading.
Low ATR often indicates:
- Consolidation
- Sideways movement
- Low volatility
Suddenly rising ATR may indicate:
- Strong breakout
- Momentum entry
- Trend beginning
This helps traders identify potential opportunities early.
However, ATR should never be used alone.
It works best with:
- Price action
- Volume
- Support and resistance
- Trend analysis
ATR and Volatility Trading
Volatility is one of the most important parts of stock market trading.
Markets behave differently during:
- Budget announcements
- RBI policy decisions
- Election results
- Global news events
ATR helps traders measure changing volatility conditions.
For example:
During major news events, ATR may suddenly rise sharply.
This warns traders to:
- Reduce position size
- Avoid emotional trading
- Increase risk management
Professional traders respect volatility because it directly affects trading performance.
Difference Between ATR and Other Indicators
Many traders confuse ATR with trend indicators.
But ATR is different.
Moving averages show trend direction.
RSI shows momentum.
MACD shows trend momentum combination.
ATR only measures volatility.
That is why ATR is often combined with other indicators for better decision making.
Common Mistakes Traders Make While Using ATR
Using ATR Alone
ATR should not be the only indicator for trading decisions.
Always combine it with:
- Price action
- Trend analysis
- Support and resistance
Ignoring Market Context
High ATR during news events can create unpredictable price movement.
Do not blindly trade based only on ATR spikes.
Wrong Stop Loss Interpretation
ATR helps in dynamic stop loss placement.
It does not mean every trade should have identical ATR-based stops.
Market structure also matters.
ATR for Beginners in Indian Stock Market
Indian markets are highly dynamic.
Indices like:
- NIFTY 50
- NIFTY BANK
- SENSEX
often show strong volatility.
ATR becomes very useful in:
- Options trading
- Futures trading
- Intraday trading
- Swing trading
Many beginners ignore volatility and focus only on entry signals.
But experienced traders know:
Protecting capital is more important than frequent trading.
This practical mindset is taught deeply at Stock Market Vidya share market classes.
Practical Example of ATR in Trading
Suppose:
- A stock price = ₹1000
- ATR = ₹20
This means average movement is around ₹20.
If you place a stop loss of ₹3:
- Chances of getting stopped out become very high
If you place stop loss considering ATR:
- Trade gets more breathing space
This is how professional traders trade with logic instead of emotions.
Why ATR is Popular Among Professional Traders
Professional traders love ATR because it helps create:
- Trading discipline
- Risk control
- Better stop losses
- Volatility awareness
- Position sizing accuracy
ATR helps traders think statistically rather than emotionally.
This is one of the biggest differences between beginners and professionals.
Learn Practical Trading at Stock Market Vidya Nagpur
Learning indicators from YouTube videos is easy.
But understanding how to practically use them in market conditions requires proper guidance.
Stock Market Vidya Nagpur is known as one of the trusted names for stock market education and share market training in Nagpur.
The institute focuses on practical market learning with simple teaching methods suitable for:
- College students
- Working professionals
- Housewives
- Business owners
- Beginners
- Active traders
The training is conducted by Prashant Sarode, who has a vast experience in stock market education and trading concepts.
Students learn:
- Technical analysis
- Candlestick patterns
- Risk management
- Trading psychology
- Options trading basics
- Intraday trading concepts
- Swing trading methods
- Market discipline
The biggest advantage of joining a structured stock market course in Nagpur is that students learn step-by-step instead of depending on random social media content.
Why Many Students Prefer Stock Market Vidya
There are many reasons why learners search for the Best share market classes in Nagpur and choose StockMarketVidya.com.
Simple Teaching Style
Complex market concepts are explained in simple Indian English.
Practical Market Approach
Focus is given on chart understanding and practical trading knowledge.
NISM Certified Trainer
Prashant Sarode provides structured learning based on practical experience and market understanding.
Beginner-Friendly Learning
Even students with zero market knowledge can understand the concepts step-by-step.
Focus on Trading Discipline
Many people learn indicators but ignore psychology and discipline.
Stock Market Vidya focuses on building the right trading mindset.
ATR and Long-Term Trading Success
Many traders search for:
- Best indicator for intraday trading
- Best strategy for options trading
- Best stock market tips
But long-term success does not come from shortcuts.
It comes from:
- Risk management
- Discipline
- Emotional control
- Proper learning
- Consistency
ATR supports all these areas.
That is why ATR remains one of the most respected indicators among serious traders.
Final Thoughts
Average True Range (ATR) is one of the most practical and powerful indicators for understanding market volatility.
It may look simple, but it can completely change the way traders manage:
- Stop loss
- Risk
- Position sizing
- Trading psychology
- Volatility handling
ATR does not predict the market direction, but it prepares traders for real market movement.
That is why both beginners and professional traders use ATR regularly.
If you want to build strong practical stock market knowledge and understand indicators like ATR deeply, joining a structured share market course in Nagpur can make a huge difference.
Stock Market Vidya, led by Prashant Sarode, continues helping students understand the stock market with practical and disciplined learning methods.
For course details:
- Website: StockMarketVidya.com
- Mobile: 9822718163, 8421893845
If you truly want to grow in trading, start by understanding volatility — and ATR is one of the best tools to begin that journey.
Frequently Asked Questions (FAQs) About Average True Range (ATR)
What is Average True Range (ATR) in stock market trading?
Average True Range (ATR) is a technical indicator used to measure market volatility. It shows how much a stock, index, or asset moves on average during a specific period. ATR helps traders understand whether the market is highly volatile or moving slowly.
Who created the ATR indicator?
ATR was developed by J. Welles Wilder Jr., a famous technical analyst who also created other popular indicators like RSI and ADX.
What does a high ATR value mean?
A high ATR value means the market is experiencing high volatility. Prices are moving strongly and the range between high and low prices is larger.
This usually happens during:
- Breakouts
- News events
- Strong trends
- Market panic or excitement
What does a low ATR value indicate?
A low ATR value indicates low volatility in the market. Prices are moving in a smaller range and the market may be consolidating or moving sideways.
Does ATR show buy and sell signals?
No, ATR does not provide direct buy or sell signals. It only measures volatility.
Traders combine ATR with:
- Price action
- Support and resistance
- Trend analysis
- Candlestick patterns
to make better trading decisions.
What is the best ATR setting for beginners?
Most traders use the 14-period ATR setting because it provides balanced volatility readings for:
- Intraday trading
- Swing trading
- Positional trading
Beginners should start with 14 ATR before experimenting with other settings.
How is ATR useful in intraday trading?
ATR helps intraday traders:
- Identify volatile stocks
- Place proper stop losses
- Avoid emotional trading
- Understand expected market movement
It helps traders trade more systematically instead of randomly entering trades.
Can ATR help in setting stop loss?
Yes, ATR is widely used for stop loss placement.
Many traders use:
- 1 ATR stop loss
- 1.5 ATR stop loss
- 2 ATR stop loss
This allows the stop loss to adjust according to market volatility.
Is ATR useful for options trading?
Yes, ATR is very useful in options trading because volatility directly affects option premiums and price movement.
Traders use ATR to:
- Measure expected movement
- Manage risk
- Plan entries and exits
What is the difference between ATR and RSI?
ATR measures volatility, while RSI measures momentum.
- ATR tells how much price is moving
- RSI tells whether the stock is overbought or oversold
Both indicators serve different purposes.
Can beginners use ATR easily?
Yes, ATR is considered beginner-friendly because it is simple to understand and practical in real trading situations.
With proper learning and practice, beginners can use ATR effectively for:
- Risk management
- Stop loss planning
- Volatility analysis
Is ATR important for risk management?
Absolutely. ATR is one of the most useful tools for risk management because it helps traders understand market movement before taking trades.
Professional traders use ATR to protect capital and avoid unnecessary losses.
Can ATR predict future price direction?
No, ATR does not predict whether the market will go up or down. It only measures the strength of price movement or volatility.
Why do professional traders use ATR?
Professional traders use ATR because it helps them:
- Control risk
- Maintain discipline
- Avoid emotional trading
- Understand volatility
- Improve position sizing
ATR supports logical trading decisions.
Where can I learn practical trading concepts like ATR in Nagpur?ATR Explained for Beginners
You can learn practical trading concepts like ATR, technical analysis, risk management, and trading psychology at Stock Market Vidya Nagpur.
The institute is guided by Prashant Sarode and focuses on practical stock market education in simple Indian English.
For details:
- Website: StockMarketVidya.com
- Mobile: 9822718163, 8421893845