Understanding market momentum is one of the most important skills for any new trader. Whether you are a beginner learning technical analysis or someone exploring advanced indicators, the Stochastic Oscillator is a tool you will hear about again and again. It helps traders read the strength of price movements, identify turning points, catch early reversals, and build confidence in trade entries and exits.
This detailed guide is crafted especially for students and learners of Stock Market Vidya, Nagpur, a well-known share market training institute run by Mr. Prashant Sarode, an NISM Certified Trainer.
If you are searching for share trading classes in Nagpur, share market training in Nagpur, or the Best share market classes in Nagpur, understanding indicators like the Stochastic Oscillator will give you a strong foundation for real-world trading.
Let’s dive into this powerful momentum indicator step by step, using simple language and practical market examples.
Why Stochastic Oscillator Matters for Indian Traders
Indian traders deal with fast-moving markets—Nifty 50, Bank Nifty, mid-cap stocks, trending sectors, and intraday volatility. In such markets, momentum indicators are essential. The Stochastic Oscillator helps traders understand:
- When buyers are losing strength
- When sellers are getting exhausted
- When a price reversal is likely
- When a trend is slowing down
- When a stock is entering an overbought or oversold zone
Understanding these points gives you confidence when taking trades, especially when you learn through structured stock market training.
What Exactly Is the Stochastic Oscillator?
The Stochastic Oscillator is a momentum-based technical indicator that compares a stock’s current price to its price range over a specific period. In simple terms:
It tells you whether a stock is closing near its high or low of the recent price range.
This information helps traders judge market sentiment. If prices close near the high consistently, it means buyers are active. If prices close near the low repeatedly, sellers are dominating.
The Formula Made Easy
You don’t need to mug up formulas to use the Stochastic Oscillator, but basic understanding helps.
The key component is called %K, which calculates the current price position within a range:
%K ≈ Where the price is today compared to the lowest low and highest high of the last X days.
Then, there is %D, which is a 3-period moving average of %K.
For most traders, the standard setting is:
- 14 periods for calculation
- 3-period smoothing
These two lines (%K and %D) create buy and sell signals when they cross each other.
Why It’s Called “Stochastic”
The word “stochastic” simply means random or unpredictable. Yet George Lane, who introduced the indicator, famously said:
“Momentum changes direction before price.”
That is exactly why this indicator is so effective. It lets you sense a price shift before the trend actually changes on the chart.
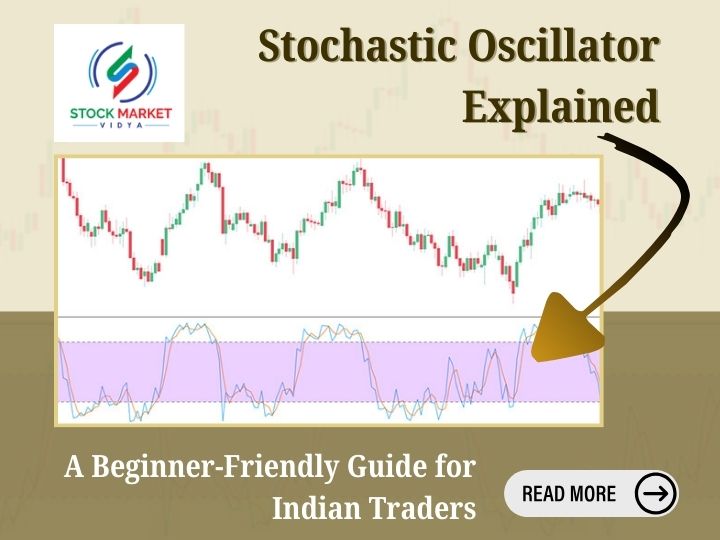
⚡ Understanding the Key Levels: 80 and 20
Although there are no strict rules, most traders use these levels:
- Above 80 → Overbought Zone
- Below 20 → Oversold Zone
However, overbought doesn’t always mean reversal. It just indicates that price has moved too fast. Similarly, oversold means selling pressure has been high.
Indian traders often misunderstand these zones. Let’s break it:
- Overbought means price is strong, not that you should sell immediately.
- Oversold means price is weak, not that you should buy blindly.
Successful use of the Stochastic Oscillator comes from combining these zones with crossovers, trend context, and price action.
The Two Lines: %K and %D Explained Clearly
%K Line — The Fast Line
This line reacts quickly to price changes. It shows immediate momentum.
%D Line — The Signal Line
This is the smoother line and reacts slowly.
Traders look for crossovers between %K and %D for entry and exit points.
When %K crosses above %D → potential buy.
When %K crosses below %D → potential sell.
This basic movement is used in almost every Stochastic trading strategy.
Fast Stochastic vs Slow Stochastic
To make things easier, charting platforms provide two versions:
Fast Stochastic
- More reactive
- More signals
- Best for intraday traders
Slow Stochastic
- Smoother
- More reliable
- Best for positional & swing traders
Indian traders using share trading classes in Nagpur often learn both, but practice helps you choose the right version based on your trading style.
How Indian Traders Use Stochastic in Real Charts
Let’s take typical market examples:
- Nifty is rallying:
Stochastic stays above 80 for long durations—indicating strong buying momentum.
- A stock is falling sharply:
Stochastic slips quickly below 20 and stays there—showing strong selling.
- During sideways markets:
Stochastic swings between 20 and 80—ideal for range trading.
This is why many students taking share market training in Nagpur learn Stochastic as one of the primary indicators.
The Most Popular Signals Using Stochastic
Let’s break down actual signals traders use:
1. Overbought & Oversold Signals
- When Stochastic goes above 80, be cautious about longs.
- When it goes below 20, be cautious about shorts.
But do not enter trades only based on these levels.
2. %K and %D Crossovers
These crossovers create precise entry and exit points.
- Bullish crossover → Buy signal
- Bearish crossover → Sell signal
Crossovers work best when combined with price action.
3. Divergence Signals
A divergence forms when:
- Price makes a new high but Stochastic doesn’t
- Price makes a new low but Stochastic doesn’t
It often hints at trend reversal.
4. Overbought but Trending Market
Many beginners misunderstand this.
A stock can remain overbought for days or weeks during a strong uptrend.
This is why you must always check the trend using:
- Moving Average
- Trendline
- Price structure
before deciding your trade.
Stochastic Trading Strategies You Can Start Using Today
Now, let’s explore strategies that are beginner-friendly and commonly taught in Best share market classes in Nagpur like Stock Market Vidya.
1. Basic Reversal Strategy
- Identify overbought/oversold level
- Wait for %K–%D crossover
- Confirm with price structure
- Enter trade with tight risk management
This works best in range-bound markets.
2. Trend Continuation Strategy
This is more advanced but powerful.
Steps:
- Identify a clear uptrend or downtrend
- Look for pullback
- Stochastic should fall to 20–40 zone in an uptrend
- Buy when %K crosses above %D
This strategy helps catch strong trending moves.
3. Stochastic With Support & Resistance
The most reliable way to use the indicator:
- Wait for Stochastic to reach oversold at support
- Wait for Stochastic to reach overbought at resistance
This combination filters out false signals.
4. Stochastic With Moving Averages
Many Indian traders use:
Steps:
- Identify direction using EMA
- Use Stochastic for timing entries
- Trade in the direction of trend only
This method reduces losses due to wrong trend interpretation.
Common Mistakes Beginners Make With Stochastic
Avoid these simple mistakes:
❌ Entering trades just because Stochastic is high or low
Overbought doesn’t mean sell. Oversold doesn’t mean buy.
❌ Using Stochastic in strong trending markets
It gives too many signals and confuses traders.
❌ Taking every crossover
Crossovers need trend context and confirmation.
❌ Using only one timeframe
Always match your trading timeframe with a higher timeframe.
❌ Using Stochastic without proper stock market training
Indicators give clarity only when paired with knowledge + discipline.
Importance of Learning Indicators in a Structured Training Environment
Indicators like Stochastic become meaningful when they are learned under proper guidance.
This is why many students prefer:
- share trading classes in Nagpur
- share market training in Nagpur
- and the Best share market classes in Nagpur
offered by Stock Market Vidya. With real chart examples, market psychology training, and practical demonstrations, you gain confidence to use tools like Stochastic effectively.
How Stochastic Helps You Grow as a Trader
By learning and mastering the Stochastic Oscillator, you can:
- Read market momentum
- Identify early trend shifts
- Find low-risk entries
- Avoid impulsive trades
- Build disciplined strategies
- Improve your accuracy
This indicator becomes a stepping stone to advance into other tools such as RSI, MACD, and Bollinger Bands.
Final Thoughts: Stochastic Oscillator Is Simple Yet Powerful
The Indian stock market is dynamic, and traders need tools that help them take timely and accurate decisions. The Stochastic Oscillator is one such tool—simple, effective, and beginner-friendly.
If you are serious about learning trading the right way, indicators like Stochastic will deepen your understanding of technical analysis. And learning under professional guidance makes the process smoother and more practical.
For structured learning, mentorship, and real-chart trading knowledge, explore the Best share market classes in Nagpur at Stock Market Vidya.
Contact Stock Market Vidya, Nagpur
For admissions, batch details, demo classes, and course information:
Mobile: 9822718163, 8421893845
Website: www.stockmarketvidya.com
[{"id":791,"link":"https:\/\/stockmarketvidya.com\/blogs\/george-soros-master-of-risk-and-reward\/","name":"george-soros-master-of-risk-and-reward","thumbnail":{"url":"https:\/\/stockmarketvidya.com\/blogs\/wp-content\/uploads\/2026\/03\/George-Soros.jpg","alt":"George Soros: Master of Risk and Reward"},"title":"George Soros: Master of Risk and Reward","author":{"name":"Share Market Blog","link":"https:\/\/stockmarketvidya.com\/blogs\/author\/share-market-blog\/"},"date":"Mar 23, 2026","dateGMT":"2026-03-23 01:05:00","modifiedDate":"2026-03-21 09:06:11","modifiedDateGMT":"2026-03-21 09:06:11","commentCount":"0","commentStatus":"open","categories":{"coma":"<a href=\"https:\/\/stockmarketvidya.com\/blogs\/category\/share-market\/\" rel=\"category tag\">Share Market<\/a>","space":"<a href=\"https:\/\/stockmarketvidya.com\/blogs\/category\/share-market\/\" rel=\"category tag\">Share Market<\/a>"},"taxonomies":{"post_tag":"<a href='https:\/\/stockmarketvidya.com\/blogs\/tag\/black-wednesday-george-soros\/' rel='post_tag'>Black Wednesday George Soros<\/a><a href='https:\/\/stockmarketvidya.com\/blogs\/tag\/george-soros-investing-style\/' rel='post_tag'>George Soros investing style<\/a><a href='https:\/\/stockmarketvidya.com\/blogs\/tag\/george-soros-trading-strategy\/' rel='post_tag'>George Soros trading strategy<\/a><a href='https:\/\/stockmarketvidya.com\/blogs\/tag\/risk-management-in-trading\/' rel='post_tag'>risk management in trading<\/a><a href='https:\/\/stockmarketvidya.com\/blogs\/tag\/stock-market-legends\/' rel='post_tag'>stock market legends<\/a><a href='https:\/\/stockmarketvidya.com\/blogs\/tag\/trading-psychology-lessons\/' rel='post_tag'>trading psychology lessons<\/a>"},"readTime":{"min":8,"sec":34},"status":"publish","excerpt":""},{"id":786,"link":"https:\/\/stockmarketvidya.com\/blogs\/sectoral-investing-identifying-growth-opportunities-in-the-stock-market\/","name":"sectoral-investing-identifying-growth-opportunities-in-the-stock-market","thumbnail":{"url":"https:\/\/stockmarketvidya.com\/blogs\/wp-content\/uploads\/2026\/03\/Sectoral-Investing.jpg","alt":"Sectoral Investing: Identifying Growth Opportunities in the Stock Market"},"title":"Sectoral Investing: Identifying Growth Opportunities in the Stock Market","author":{"name":"Share Market Blog","link":"https:\/\/stockmarketvidya.com\/blogs\/author\/share-market-blog\/"},"date":"Mar 21, 2026","dateGMT":"2026-03-21 06:10:47","modifiedDate":"2026-03-21 06:10:49","modifiedDateGMT":"2026-03-21 06:10:49","commentCount":"0","commentStatus":"open","categories":{"coma":"<a href=\"https:\/\/stockmarketvidya.com\/blogs\/category\/share-market\/\" rel=\"category tag\">Share Market<\/a>","space":"<a href=\"https:\/\/stockmarketvidya.com\/blogs\/category\/share-market\/\" rel=\"category tag\">Share Market<\/a>"},"taxonomies":{"post_tag":"<a href='https:\/\/stockmarketvidya.com\/blogs\/tag\/how-to-identify-strong-sectors\/' rel='post_tag'>how to identify strong sectors<\/a><a href='https:\/\/stockmarketvidya.com\/blogs\/tag\/option-trading-course-nagpur\/' rel='post_tag'>option trading course Nagpur<\/a><a href='https:\/\/stockmarketvidya.com\/blogs\/tag\/sector-rotation-strategy\/' rel='post_tag'>sector rotation strategy<\/a><a href='https:\/\/stockmarketvidya.com\/blogs\/tag\/sectoral-investing\/' rel='post_tag'>sectoral investing<\/a><a href='https:\/\/stockmarketvidya.com\/blogs\/tag\/share-market-classes-nagpur\/' rel='post_tag'>share market classes Nagpur<\/a><a href='https:\/\/stockmarketvidya.com\/blogs\/tag\/stock-market-course-nagpur\/' rel='post_tag'>Stock Market Course Nagpur<\/a><a href='https:\/\/stockmarketvidya.com\/blogs\/tag\/stock-market-sectors-india\/' rel='post_tag'>stock market sectors India<\/a><a href='https:\/\/stockmarketvidya.com\/blogs\/tag\/stock-market-training-nagpur\/' rel='post_tag'>stock market training Nagpur<\/a><a href='https:\/\/stockmarketvidya.com\/blogs\/tag\/technical-analysis-course-nagpur\/' rel='post_tag'>technical analysis course Nagpur<\/a>"},"readTime":{"min":9,"sec":26},"status":"publish","excerpt":""},{"id":776,"link":"https:\/\/stockmarketvidya.com\/blogs\/can-share-market-knowledge-help-students-in-future-careers-yes-heres-how\/","name":"can-share-market-knowledge-help-students-in-future-careers-yes-heres-how","thumbnail":{"url":"https:\/\/stockmarketvidya.com\/blogs\/wp-content\/uploads\/2026\/03\/Can-Share-Market-Knowledge-Help-Students-in-Future-Careers.jpg","alt":"Can Share Market Knowledge Help Students in Future Careers? Yes\u2014Here\u2019s How"},"title":"Can Share Market Knowledge Help Students in Future Careers? Yes\u2014Here\u2019s How","author":{"name":"Share Market Blog","link":"https:\/\/stockmarketvidya.com\/blogs\/author\/share-market-blog\/"},"date":"Mar 20, 2026","dateGMT":"2026-03-20 05:51:04","modifiedDate":"2026-03-20 06:13:46","modifiedDateGMT":"2026-03-20 06:13:46","commentCount":"0","commentStatus":"open","categories":{"coma":"<a href=\"https:\/\/stockmarketvidya.com\/blogs\/category\/share-market\/\" rel=\"category tag\">Share Market<\/a>","space":"<a href=\"https:\/\/stockmarketvidya.com\/blogs\/category\/share-market\/\" rel=\"category tag\">Share Market<\/a>"},"taxonomies":{"post_tag":"<a href='https:\/\/stockmarketvidya.com\/blogs\/tag\/best-trading-institute-in-nagpur\/' rel='post_tag'>best trading institute in Nagpur<\/a><a href='https:\/\/stockmarketvidya.com\/blogs\/tag\/intraday-trading-course-nagpur\/' rel='post_tag'>intraday trading course Nagpur<\/a><a href='https:\/\/stockmarketvidya.com\/blogs\/tag\/option-trading-course-nagpur\/' rel='post_tag'>option trading course Nagpur<\/a><a href='https:\/\/stockmarketvidya.com\/blogs\/tag\/share-market-course-in-nagpur\/' rel='post_tag'>Share Market Course in Nagpur<\/a><a href='https:\/\/stockmarketvidya.com\/blogs\/tag\/stock-market-classes-for-beginners\/' rel='post_tag'>stock market classes for beginners<\/a><a href='https:\/\/stockmarketvidya.com\/blogs\/tag\/stock-market-course-for-students\/' rel='post_tag'>stock market course for students<\/a><a href='https:\/\/stockmarketvidya.com\/blogs\/tag\/stock-market-training-nagpur\/' rel='post_tag'>stock market training Nagpur<\/a><a href='https:\/\/stockmarketvidya.com\/blogs\/tag\/technical-analysis-course-nagpur\/' rel='post_tag'>technical analysis course Nagpur<\/a>"},"readTime":{"min":9,"sec":12},"status":"publish","excerpt":""},{"id":769,"link":"https:\/\/stockmarketvidya.com\/blogs\/developing-a-winning-trading-mindset-the-secret-behind-successful-traders-in-the-stock-market\/","name":"developing-a-winning-trading-mindset-the-secret-behind-successful-traders-in-the-stock-market","thumbnail":{"url":"https:\/\/stockmarketvidya.com\/blogs\/wp-content\/uploads\/2026\/03\/Developing-a-Winning-Trading-Mindset-1.png","alt":"Developing a Winning Trading Mindset: The Secret Behind Successful Traders in the Stock Market"},"title":"Developing a Winning Trading Mindset: The Secret Behind Successful Traders in the Stock Market","author":{"name":"Share Market Blog","link":"https:\/\/stockmarketvidya.com\/blogs\/author\/share-market-blog\/"},"date":"Mar 14, 2026","dateGMT":"2026-03-14 01:00:00","modifiedDate":"2026-03-21 07:03:43","modifiedDateGMT":"2026-03-21 07:03:43","commentCount":"0","commentStatus":"open","categories":{"coma":"<a href=\"https:\/\/stockmarketvidya.com\/blogs\/category\/share-market\/\" rel=\"category tag\">Share Market<\/a>, <a href=\"https:\/\/stockmarketvidya.com\/blogs\/category\/share-market-course\/\" rel=\"category tag\">Share Market Course<\/a>","space":"<a href=\"https:\/\/stockmarketvidya.com\/blogs\/category\/share-market\/\" rel=\"category tag\">Share Market<\/a> <a href=\"https:\/\/stockmarketvidya.com\/blogs\/category\/share-market-course\/\" rel=\"category tag\">Share Market Course<\/a>"},"taxonomies":{"post_tag":"<a href='https:\/\/stockmarketvidya.com\/blogs\/tag\/emotional-trading-control\/' rel='post_tag'>emotional trading control<\/a><a href='https:\/\/stockmarketvidya.com\/blogs\/tag\/intraday-trading-mindset\/' rel='post_tag'>intraday trading mindset<\/a><a href='https:\/\/stockmarketvidya.com\/blogs\/tag\/learn-trading-in-nagpur\/' rel='post_tag'>Learn Trading in Nagpur<\/a><a href='https:\/\/stockmarketvidya.com\/blogs\/tag\/share-market-course-nagpur\/' rel='post_tag'>share market course Nagpur<\/a><a href='https:\/\/stockmarketvidya.com\/blogs\/tag\/stock-market-classes-nagpur\/' rel='post_tag'>Stock market classes Nagpur<\/a><a href='https:\/\/stockmarketvidya.com\/blogs\/tag\/stock-market-psychology\/' rel='post_tag'>stock market psychology<\/a><a href='https:\/\/stockmarketvidya.com\/blogs\/tag\/technical-analysis-course-nagpur\/' rel='post_tag'>technical analysis course Nagpur<\/a>"},"readTime":{"min":15,"sec":42},"status":"publish","excerpt":""},{"id":766,"link":"https:\/\/stockmarketvidya.com\/blogs\/how-dividends-work-earn-passive-income-from-shares-in-the-indian-stock-market\/","name":"how-dividends-work-earn-passive-income-from-shares-in-the-indian-stock-market","thumbnail":{"url":"https:\/\/stockmarketvidya.com\/blogs\/wp-content\/uploads\/2026\/03\/How-Dividends-Work.jpg","alt":"How Dividends Work: Earn Passive Income from Shares in the Indian Stock Market"},"title":"How Dividends Work: Earn Passive Income from Shares in the Indian Stock Market","author":{"name":"Share Market Blog","link":"https:\/\/stockmarketvidya.com\/blogs\/author\/share-market-blog\/"},"date":"Mar 13, 2026","dateGMT":"2026-03-13 07:12:26","modifiedDate":"2026-03-13 07:12:28","modifiedDateGMT":"2026-03-13 07:12:28","commentCount":"0","commentStatus":"open","categories":{"coma":"<a href=\"https:\/\/stockmarketvidya.com\/blogs\/category\/share-market\/\" rel=\"category tag\">Share Market<\/a>, <a href=\"https:\/\/stockmarketvidya.com\/blogs\/category\/share-market-course\/\" rel=\"category tag\">Share Market Course<\/a>","space":"<a href=\"https:\/\/stockmarketvidya.com\/blogs\/category\/share-market\/\" rel=\"category tag\">Share Market<\/a> <a href=\"https:\/\/stockmarketvidya.com\/blogs\/category\/share-market-course\/\" rel=\"category tag\">Share Market Course<\/a>"},"taxonomies":{"post_tag":"<a href='https:\/\/stockmarketvidya.com\/blogs\/tag\/dividend-investing\/' rel='post_tag'>dividend investing<\/a><a href='https:\/\/stockmarketvidya.com\/blogs\/tag\/dividend-stocks-india\/' rel='post_tag'>dividend stocks India<\/a><a href='https:\/\/stockmarketvidya.com\/blogs\/tag\/financial-investing-india\/' rel='post_tag'>financial investing India<\/a><a href='https:\/\/stockmarketvidya.com\/blogs\/tag\/long-term-investing-2\/' rel='post_tag'>long term investing<\/a><a href='https:\/\/stockmarketvidya.com\/blogs\/tag\/passive-income-from-shares\/' rel='post_tag'>passive income from shares<\/a><a href='https:\/\/stockmarketvidya.com\/blogs\/tag\/portfolio-income-investing\/' rel='post_tag'>portfolio income investing<\/a><a href='https:\/\/stockmarketvidya.com\/blogs\/tag\/stock-market-beginners\/' rel='post_tag'>stock market beginners<\/a><a href='https:\/\/stockmarketvidya.com\/blogs\/tag\/stock-market-education\/' rel='post_tag'>Stock market education<\/a><a href='https:\/\/stockmarketvidya.com\/blogs\/tag\/wealth-creation-through-stocks\/' rel='post_tag'>wealth creation through stocks<\/a>"},"readTime":{"min":15,"sec":46},"status":"publish","excerpt":""},{"id":758,"link":"https:\/\/stockmarketvidya.com\/blogs\/small-cap-vs-mid-cap-vs-large-cap-stocks-where-should-smart-investors-in-nagpur-invest\/","name":"small-cap-vs-mid-cap-vs-large-cap-stocks-where-should-smart-investors-in-nagpur-invest","thumbnail":{"url":"https:\/\/stockmarketvidya.com\/blogs\/wp-content\/uploads\/2026\/03\/Small-Cap-vs-Mid-Cap-vs-Large-Cap-Stocks.jpg","alt":"Small Cap vs Mid Cap vs Large Cap Stocks: Where Should Smart Investors in Nagpur Invest?"},"title":"Small Cap vs Mid Cap vs Large Cap Stocks: Where Should Smart Investors in Nagpur Invest?","author":{"name":"Share Market Blog","link":"https:\/\/stockmarketvidya.com\/blogs\/author\/share-market-blog\/"},"date":"Mar 6, 2026","dateGMT":"2026-03-06 01:00:00","modifiedDate":"2026-03-04 11:33:11","modifiedDateGMT":"2026-03-04 11:33:11","commentCount":"0","commentStatus":"open","categories":{"coma":"<a href=\"https:\/\/stockmarketvidya.com\/blogs\/category\/share-market\/\" rel=\"category tag\">Share Market<\/a>, <a href=\"https:\/\/stockmarketvidya.com\/blogs\/category\/share-market-course\/\" rel=\"category tag\">Share Market Course<\/a>","space":"<a href=\"https:\/\/stockmarketvidya.com\/blogs\/category\/share-market\/\" rel=\"category tag\">Share Market<\/a> <a href=\"https:\/\/stockmarketvidya.com\/blogs\/category\/share-market-course\/\" rel=\"category tag\">Share Market Course<\/a>"},"taxonomies":{"post_tag":"<a href='https:\/\/stockmarketvidya.com\/blogs\/tag\/difference-between-small-mid-large-cap\/' rel='post_tag'>difference between small mid large cap<\/a><a href='https:\/\/stockmarketvidya.com\/blogs\/tag\/equity-investment-guide\/' rel='post_tag'>equity investment guide<\/a><a href='https:\/\/stockmarketvidya.com\/blogs\/tag\/investment-strategy-india-portfolio-diversification\/' rel='post_tag'>investment strategy India portfolio diversification<\/a><a href='https:\/\/stockmarketvidya.com\/blogs\/tag\/market-capitalization-explained\/' rel='post_tag'>market capitalization explained<\/a><a href='https:\/\/stockmarketvidya.com\/blogs\/tag\/market-cycles-investing\/' rel='post_tag'>market cycles investing<\/a><a href='https:\/\/stockmarketvidya.com\/blogs\/tag\/nifty-midcap-150\/' rel='post_tag'>NIFTY Midcap 150<\/a><a href='https:\/\/stockmarketvidya.com\/blogs\/tag\/nifty-smallcap-250\/' rel='post_tag'>NIFTY Smallcap 250<\/a><a href='https:\/\/stockmarketvidya.com\/blogs\/tag\/risk-management-in-stock-market-long-term-investing-india\/' rel='post_tag'>risk management in stock market long term investing India<\/a><a href='https:\/\/stockmarketvidya.com\/blogs\/tag\/sebi-stock-classification\/' rel='post_tag'>SEBI stock classification<\/a><a href='https:\/\/stockmarketvidya.com\/blogs\/tag\/share-market-classes-nagpur\/' rel='post_tag'>share market classes Nagpur<\/a><a href='https:\/\/stockmarketvidya.com\/blogs\/tag\/share-trading-classes-nagpur\/' rel='post_tag'>Share Trading Classes Nagpur<\/a><a href='https:\/\/stockmarketvidya.com\/blogs\/tag\/stock-market-course-nagpur\/' rel='post_tag'>Stock Market Course Nagpur<\/a><a href='https:\/\/stockmarketvidya.com\/blogs\/tag\/stock-market-training-nagpur\/' rel='post_tag'>stock market training Nagpur<\/a><a href='https:\/\/stockmarketvidya.com\/blogs\/tag\/stock-market-vidya\/' rel='post_tag'>Stock Market Vidya<\/a>"},"readTime":{"min":9,"sec":59},"status":"publish","excerpt":""},{"id":760,"link":"https:\/\/stockmarketvidya.com\/blogs\/stock-exchanges-explained-in-simple-words-nse-vs-bse-which-one-matters-for-you-as-a-trader\/","name":"stock-exchanges-explained-in-simple-words-nse-vs-bse-which-one-matters-for-you-as-a-trader","thumbnail":{"url":"https:\/\/stockmarketvidya.com\/blogs\/wp-content\/uploads\/2026\/03\/NSE-vs-BSE.jpg","alt":"Stock Exchanges Explained in Simple Words: NSE vs BSE \u2013 Which One Matters for You as a Trader?"},"title":"Stock Exchanges Explained in Simple Words: NSE vs BSE \u2013 Which One Matters for You as a Trader?","author":{"name":"Share Market Blog","link":"https:\/\/stockmarketvidya.com\/blogs\/author\/share-market-blog\/"},"date":"Mar 4, 2026","dateGMT":"2026-03-04 10:54:30","modifiedDate":"2026-03-04 10:54:31","modifiedDateGMT":"2026-03-04 10:54:31","commentCount":"0","commentStatus":"open","categories":{"coma":"<a href=\"https:\/\/stockmarketvidya.com\/blogs\/category\/share-market\/\" rel=\"category tag\">Share Market<\/a>, <a href=\"https:\/\/stockmarketvidya.com\/blogs\/category\/share-market-course\/\" rel=\"category tag\">Share Market Course<\/a>","space":"<a href=\"https:\/\/stockmarketvidya.com\/blogs\/category\/share-market\/\" rel=\"category tag\">Share Market<\/a> <a href=\"https:\/\/stockmarketvidya.com\/blogs\/category\/share-market-course\/\" rel=\"category tag\">Share Market Course<\/a>"},"taxonomies":{"post_tag":"<a href='https:\/\/stockmarketvidya.com\/blogs\/tag\/equity-market-india\/' rel='post_tag'>equity market India<\/a><a href='https:\/\/stockmarketvidya.com\/blogs\/tag\/futures-and-options-nse\/' rel='post_tag'>Futures and Options NSE<\/a><a href='https:\/\/stockmarketvidya.com\/blogs\/tag\/market-depth-analysis\/' rel='post_tag'>market depth analysis<\/a><a href='https:\/\/stockmarketvidya.com\/blogs\/tag\/order-matching-system\/' rel='post_tag'>order matching system<\/a><a href='https:\/\/stockmarketvidya.com\/blogs\/tag\/share-market-course-nagpur\/' rel='post_tag'>share market course Nagpur<\/a><a href='https:\/\/stockmarketvidya.com\/blogs\/tag\/share-trading-classes-nagpur\/' rel='post_tag'>Share Trading Classes Nagpur<\/a><a href='https:\/\/stockmarketvidya.com\/blogs\/tag\/stock-market-basics\/' rel='post_tag'>stock market basics<\/a><a href='https:\/\/stockmarketvidya.com\/blogs\/tag\/stock-market-for-beginners\/' rel='post_tag'>Stock market for beginners<\/a><a href='https:\/\/stockmarketvidya.com\/blogs\/tag\/stock-market-training-nagpur\/' rel='post_tag'>stock market training Nagpur<\/a><a href='https:\/\/stockmarketvidya.com\/blogs\/tag\/stock-market-vidya-nagpur\/' rel='post_tag'>Stock Market Vidya Nagpur<\/a><a href='https:\/\/stockmarketvidya.com\/blogs\/tag\/t1-settlement-cycle\/' rel='post_tag'>T+1 settlement cycle<\/a><a href='https:\/\/stockmarketvidya.com\/blogs\/tag\/trading-education-india\/' rel='post_tag'>trading education india<\/a>"},"readTime":{"min":11,"sec":24},"status":"publish","excerpt":""},{"id":744,"link":"https:\/\/stockmarketvidya.com\/blogs\/etf-is-the-smartest-investment-choice-today-a-practical-guide-for-modern-investors\/","name":"etf-is-the-smartest-investment-choice-today-a-practical-guide-for-modern-investors","thumbnail":{"url":"https:\/\/stockmarketvidya.com\/blogs\/wp-content\/uploads\/2026\/02\/ETF-Is-the-Smartest-Investment-Choice-Today-2.jpg","alt":""},"title":"ETF Is the Smartest Investment Choice Today \u2013 A Practical Guide for Modern Investors","author":{"name":"Share Market Blog","link":"https:\/\/stockmarketvidya.com\/blogs\/author\/share-market-blog\/"},"date":"Feb 26, 2026","dateGMT":"2026-02-26 12:29:32","modifiedDate":"2026-02-26 12:30:23","modifiedDateGMT":"2026-02-26 12:30:23","commentCount":"0","commentStatus":"open","categories":{"coma":"<a href=\"https:\/\/stockmarketvidya.com\/blogs\/category\/share-market\/\" rel=\"category tag\">Share Market<\/a>","space":"<a href=\"https:\/\/stockmarketvidya.com\/blogs\/category\/share-market\/\" rel=\"category tag\">Share Market<\/a>"},"taxonomies":{"post_tag":""},"readTime":{"min":10,"sec":51},"status":"publish","excerpt":""},{"id":739,"link":"https:\/\/stockmarketvidya.com\/blogs\/short-strangle-strategy-in-a-sideways-market\/","name":"short-strangle-strategy-in-a-sideways-market","thumbnail":{"url":"https:\/\/stockmarketvidya.com\/blogs\/wp-content\/uploads\/2026\/02\/Short-Strangle-Strategy-in-a-marketing-Experts.png","alt":"Short Strangle Strategy in a Sideways Market"},"title":"Short Strangle Strategy in a Sideways Market","author":{"name":"Share Market Blog","link":"https:\/\/stockmarketvidya.com\/blogs\/author\/share-market-blog\/"},"date":"Feb 22, 2026","dateGMT":"2026-02-22 01:00:00","modifiedDate":"2026-02-20 07:38:34","modifiedDateGMT":"2026-02-20 07:38:34","commentCount":"0","commentStatus":"open","categories":{"coma":"<a href=\"https:\/\/stockmarketvidya.com\/blogs\/category\/share-market\/\" rel=\"category tag\">Share Market<\/a>, <a href=\"https:\/\/stockmarketvidya.com\/blogs\/category\/share-market-course\/\" rel=\"category tag\">Share Market Course<\/a>","space":"<a href=\"https:\/\/stockmarketvidya.com\/blogs\/category\/share-market\/\" rel=\"category tag\">Share Market<\/a> <a href=\"https:\/\/stockmarketvidya.com\/blogs\/category\/share-market-course\/\" rel=\"category tag\">Share Market Course<\/a>"},"taxonomies":{"post_tag":""},"readTime":{"min":9,"sec":24},"status":"publish","excerpt":""},{"id":734,"link":"https:\/\/stockmarketvidya.com\/blogs\/buy-strangle-strategy-in-a-volatile-market-how-smart-traders-profit-from-big-price-moves\/","name":"buy-strangle-strategy-in-a-volatile-market-how-smart-traders-profit-from-big-price-moves","thumbnail":{"url":"https:\/\/stockmarketvidya.com\/blogs\/wp-content\/uploads\/2026\/02\/Buy-Strangle-Strategy-in-a-Volatile-Market.jpg","alt":"Buy Strangle Strategy in a Volatile Market: How Smart Traders Profit from Big Price Moves"},"title":"Buy Strangle Strategy in a Volatile Market: How Smart Traders Profit from Big Price Moves","author":{"name":"Share Market Blog","link":"https:\/\/stockmarketvidya.com\/blogs\/author\/share-market-blog\/"},"date":"Feb 20, 2026","dateGMT":"2026-02-20 06:36:50","modifiedDate":"2026-02-20 06:36:52","modifiedDateGMT":"2026-02-20 06:36:52","commentCount":"0","commentStatus":"open","categories":{"coma":"<a href=\"https:\/\/stockmarketvidya.com\/blogs\/category\/share-market\/\" rel=\"category tag\">Share Market<\/a>, <a href=\"https:\/\/stockmarketvidya.com\/blogs\/category\/share-market-course\/\" rel=\"category tag\">Share Market Course<\/a>","space":"<a href=\"https:\/\/stockmarketvidya.com\/blogs\/category\/share-market\/\" rel=\"category tag\">Share Market<\/a> <a href=\"https:\/\/stockmarketvidya.com\/blogs\/category\/share-market-course\/\" rel=\"category tag\">Share Market Course<\/a>"},"taxonomies":{"post_tag":""},"readTime":{"min":8,"sec":20},"status":"publish","excerpt":""},{"id":727,"link":"https:\/\/stockmarketvidya.com\/blogs\/short-straddle-in-sideways-market-a-complete-traders-perspective\/","name":"short-straddle-in-sideways-market-a-complete-traders-perspective","thumbnail":{"url":"https:\/\/stockmarketvidya.com\/blogs\/wp-content\/uploads\/2026\/02\/Short-Straddle-in-Sideways-Market.jpg","alt":"Short Straddle in Sideways Market: A Complete Trader\u2019s Perspective"},"title":"Short Straddle in Sideways Market: A Complete Trader\u2019s Perspective","author":{"name":"Share Market Blog","link":"https:\/\/stockmarketvidya.com\/blogs\/author\/share-market-blog\/"},"date":"Feb 13, 2026","dateGMT":"2026-02-13 01:55:00","modifiedDate":"2026-02-11 06:28:05","modifiedDateGMT":"2026-02-11 06:28:05","commentCount":"0","commentStatus":"open","categories":{"coma":"<a href=\"https:\/\/stockmarketvidya.com\/blogs\/category\/share-market\/\" rel=\"category tag\">Share Market<\/a>","space":"<a href=\"https:\/\/stockmarketvidya.com\/blogs\/category\/share-market\/\" rel=\"category tag\">Share Market<\/a>"},"taxonomies":{"post_tag":"<a href='https:\/\/stockmarketvidya.com\/blogs\/tag\/bank-nifty-option-selling-strategy\/' rel='post_tag'>BANK NIFTY option selling strategy<\/a><a href='https:\/\/stockmarketvidya.com\/blogs\/tag\/best-share-market-classes-in-nagpur\/' rel='post_tag'>Best share market classes in Nagpur<\/a><a href='https:\/\/stockmarketvidya.com\/blogs\/tag\/expiry-day-trading-strategy\/' rel='post_tag'>expiry day trading strategy<\/a><a href='https:\/\/stockmarketvidya.com\/blogs\/tag\/nifty-short-straddle\/' rel='post_tag'>NIFTY Short Straddle<\/a><a href='https:\/\/stockmarketvidya.com\/blogs\/tag\/nism-certified-trainer-nagpur\/' rel='post_tag'>NISM Certified Trainer Nagpur<\/a><a href='https:\/\/stockmarketvidya.com\/blogs\/tag\/non-directional-options-strategy\/' rel='post_tag'>Non Directional Options Strategy<\/a><a href='https:\/\/stockmarketvidya.com\/blogs\/tag\/option-selling-course-nagpur\/' rel='post_tag'>option selling course Nagpur<\/a><a href='https:\/\/stockmarketvidya.com\/blogs\/tag\/option-selling-strategy\/' rel='post_tag'>option selling strategy<\/a><a href='https:\/\/stockmarketvidya.com\/blogs\/tag\/options-trading-for-beginners\/' rel='post_tag'>Options trading for beginners<\/a><a href='https:\/\/stockmarketvidya.com\/blogs\/tag\/premium-decay-strategy\/' rel='post_tag'>premium decay strategy<\/a><a href='https:\/\/stockmarketvidya.com\/blogs\/tag\/professional-stock-market-training\/' rel='post_tag'>professional stock market training<\/a><a href='https:\/\/stockmarketvidya.com\/blogs\/tag\/range-bound-market-strategy\/' rel='post_tag'>range bound market strategy<\/a><a href='https:\/\/stockmarketvidya.com\/blogs\/tag\/share-market-classes-in-nagpur\/' rel='post_tag'>Share Market Classes in Nagpur<\/a><a href='https:\/\/stockmarketvidya.com\/blogs\/tag\/share-market-training-in-nagpur\/' rel='post_tag'>share market training in Nagpur<\/a><a href='https:\/\/stockmarketvidya.com\/blogs\/tag\/short-straddle-in-sideways-market\/' rel='post_tag'>Short Straddle in sideways market<\/a><a href='https:\/\/stockmarketvidya.com\/blogs\/tag\/short-straddle-strategy\/' rel='post_tag'>Short Straddle strategy<\/a><a href='https:\/\/stockmarketvidya.com\/blogs\/tag\/sideways-market-trading-strategy\/' rel='post_tag'>sideways market trading strategy<\/a><a href='https:\/\/stockmarketvidya.com\/blogs\/tag\/stock-market-course-near-me\/' rel='post_tag'>stock market course near me<\/a><a href='https:\/\/stockmarketvidya.com\/blogs\/tag\/stock-market-vidya-nagpur\/' rel='post_tag'>Stock Market Vidya Nagpur<\/a><a href='https:\/\/stockmarketvidya.com\/blogs\/tag\/time-decay-trading-strategy\/' rel='post_tag'>time decay trading strategy<\/a><a href='https:\/\/stockmarketvidya.com\/blogs\/tag\/volatility-based-option-selling\/' rel='post_tag'>volatility based option selling<\/a>"},"readTime":{"min":8,"sec":31},"status":"publish","excerpt":""},{"id":720,"link":"https:\/\/stockmarketvidya.com\/blogs\/buy-straddle-strategy-in-a-volatile-market-how-smart-traders-trade-big-moves-without-predicting-direction\/","name":"buy-straddle-strategy-in-a-volatile-market-how-smart-traders-trade-big-moves-without-predicting-direction","thumbnail":{"url":"https:\/\/stockmarketvidya.com\/blogs\/wp-content\/uploads\/2026\/02\/Buy-Straddle-Strategy-in-a-Volatile-Market.jpg","alt":"Buy Straddle Strategy in a Volatile Market: How Smart Traders Trade Big Moves Without Predicting Direction"},"title":"Buy Straddle Strategy in a Volatile Market: How Smart Traders Trade Big Moves Without Predicting Direction","author":{"name":"Share Market Blog","link":"https:\/\/stockmarketvidya.com\/blogs\/author\/share-market-blog\/"},"date":"Feb 11, 2026","dateGMT":"2026-02-11 05:52:31","modifiedDate":"2026-02-11 06:39:48","modifiedDateGMT":"2026-02-11 06:39:48","commentCount":"1","commentStatus":"open","categories":{"coma":"<a href=\"https:\/\/stockmarketvidya.com\/blogs\/category\/share-market\/\" rel=\"category tag\">Share Market<\/a>","space":"<a href=\"https:\/\/stockmarketvidya.com\/blogs\/category\/share-market\/\" rel=\"category tag\">Share Market<\/a>"},"taxonomies":{"post_tag":"<a href='https:\/\/stockmarketvidya.com\/blogs\/tag\/banknifty-straddle-strategy\/' rel='post_tag'>BANKNIFTY straddle strategy<\/a><a href='https:\/\/stockmarketvidya.com\/blogs\/tag\/best-share-market-classes-in-nagpur\/' rel='post_tag'>Best share market classes in Nagpur<\/a><a href='https:\/\/stockmarketvidya.com\/blogs\/tag\/buy-straddle-in-volatile-market\/' rel='post_tag'>Buy Straddle in volatile market<\/a><a href='https:\/\/stockmarketvidya.com\/blogs\/tag\/buy-straddle-strategy\/' rel='post_tag'>Buy Straddle strategy<\/a><a href='https:\/\/stockmarketvidya.com\/blogs\/tag\/direction-neutral-trading-strategy\/' rel='post_tag'>direction neutral trading strategy<\/a><a href='https:\/\/stockmarketvidya.com\/blogs\/tag\/event-based-trading\/' rel='post_tag'>event based trading<\/a><a href='https:\/\/stockmarketvidya.com\/blogs\/tag\/how-to-trade-straddle\/' rel='post_tag'>how to trade straddle<\/a><a href='https:\/\/stockmarketvidya.com\/blogs\/tag\/intraday-options-strategy\/' rel='post_tag'>intraday options strategy<\/a><a href='https:\/\/stockmarketvidya.com\/blogs\/tag\/nifty-options-strategy\/' rel='post_tag'>Nifty Options Strategy<\/a><a href='https:\/\/stockmarketvidya.com\/blogs\/tag\/nism-certified-trainer-nagpur\/' rel='post_tag'>NISM Certified Trainer Nagpur<\/a><a href='https:\/\/stockmarketvidya.com\/blogs\/tag\/options-trading-course-nagpur\/' rel='post_tag'>options trading course Nagpur<\/a><a href='https:\/\/stockmarketvidya.com\/blogs\/tag\/options-trading-for-beginners\/' rel='post_tag'>Options trading for beginners<\/a><a href='https:\/\/stockmarketvidya.com\/blogs\/tag\/options-trading-strategy\/' rel='post_tag'>Options trading strategy<\/a><a href='https:\/\/stockmarketvidya.com\/blogs\/tag\/risk-management-in-options-trading\/' rel='post_tag'>risk management in options trading<\/a><a href='https:\/\/stockmarketvidya.com\/blogs\/tag\/share-market-classes-in-nagpur\/' rel='post_tag'>Share Market Classes in Nagpur<\/a><a href='https:\/\/stockmarketvidya.com\/blogs\/tag\/share-market-training-in-nagpur\/' rel='post_tag'>share market training in Nagpur<\/a><a href='https:\/\/stockmarketvidya.com\/blogs\/tag\/stock-market-course-near-me\/' rel='post_tag'>stock market course near me<\/a><a href='https:\/\/stockmarketvidya.com\/blogs\/tag\/stock-market-vidya-nagpur\/' rel='post_tag'>Stock Market Vidya Nagpur<\/a><a href='https:\/\/stockmarketvidya.com\/blogs\/tag\/volatility-based-trading\/' rel='post_tag'>volatility based trading<\/a><a href='https:\/\/stockmarketvidya.com\/blogs\/tag\/volatility-trading-strategy\/' rel='post_tag'>volatility trading strategy<\/a>"},"readTime":{"min":8,"sec":47},"status":"publish","excerpt":""}]