In the world of price action, indicators come and go, strategies evolve every decade, and new traders often get confused about where to look first. But no matter how advanced the trading system becomes, there is one concept that never loses relevance—Moving Averages.
Whether you trade short-term, long-term, intraday, options, or swing positions, moving averages act like a map, showing you where the price is heading and how strong a trend is. For many learners who join share trading classes in Nagpur, the moving average becomes the first technical indicator they truly understand and trust.
This article will take you deep into the world of moving averages—what they mean, how they work, the types, why they matter, and how traders apply them in real chart conditions. Stock Market Vidya, Nagpur, the goal here is not just to explain but to make you think like a trader.
Let’s begin the journey.
1. Moving Average: The Heartbeat of Market Trends
A Moving Average (MA) is a simple yet powerful tool that smooths out the price movement over a specific period.
Because price moves fast—sometimes too fast—it creates confusion. The market may look bullish one moment and bearish the next.
A moving average removes noise and gives you a clean, easy-to-read trend direction.
Imagine watching a stream of water. Waves rise and fall, but if you look from a distance, you notice a clearer direction. Moving averages do the same for prices.
Many traders who enroll in share market training in Nagpur start their technical analysis journey with moving averages because they provide:
- Trend direction
- Support & resistance zones
- Entry and exit levels
- Momentum understanding
- Reversal indications
A moving average is more than a line—it is a storyteller.
2. Why Traders Rely on Moving Averages
Moving averages have one job: clarity.
When the market is volatile, moving averages bring stability. When the price is confusing, they reveal structure.
Here’s why they matter across trading styles:
They help you spot the trend
If the price is above the moving average, the trend is up.
If the price stays below the moving average, the trend is down.
This simple rule forms the foundation of many strategies taught in professional stock market course curriculums.
They act as dynamic support and resistance
Unlike horizontal lines, moving averages move with price.
They bend, adjust, and shift with new information.
They filter noise
New traders often get trapped in misleading candles.
Moving averages help them see the larger picture.
They form the base of advanced strategies
Indicators like MACD, Alligator, Supertrend, and various automated systems use moving averages as their core.
This is why students looking for the Best share market classes in Nagpur value moving averages early in their learning phase—they improve decision-making instantly.
3. Types of Moving Averages: Understanding the Building Blocks
There are many variations of moving averages, each one offering a different view of market data.
Below, you’ll learn the major types used in trading.
The four most widely used types are:
- Simple Moving Average (SMA)
- Exponential Moving Average (EMA)
- Weighted Moving Average (WMA)
- Smoothed Moving Average (SMMA)
Let’s break them down one by one.
4. Simple Moving Average (SMA): The Classic Foundation
What is SMA?
The Simple Moving Average is the most basic form of moving average. It takes the closing prices of a given number of days, adds them together, and divides by the number of days.
For example:
A 20-day SMA = sum of last 20 closing prices ÷ 20.
Why do traders love SMA?
Because it is clean, slow, and stable. It doesn’t react quickly to sudden spikes or drops.
It gives a smooth line, perfect for identifying long-term trends.
Where SMA is used
Students joining share market course near me frequently encounter SMA in:
- Swing trading
- Long-term investing
- Trend-following systems
- Identifying price zones
Strength of SMA
- Great for slow, stable trend analysis
- Easy to read
- Highly reliable for long-term charts
Weakness of SMA
- Slow to react
- May lag during rapid price changes
SMA is like a calm teacher—it doesn’t get excited by market noise.
5. Exponential Moving Average (EMA): The Fast & Reactive One
What is EMA?
The Exponential Moving Average gives more weight to recent prices.
This means it reacts faster than SMA.
Traders who want quick signals—especially intraday and swing traders—prefer EMA.
Why EMA matters
EMA helps identify trend changes earlier than SMA.
For example, if the market suddenly turns bullish, EMA will reflect it faster.
Where EMA is used
- Intraday trading
- Options buying
- Scalping
- Fast-moving markets
- Algorithmic strategies
Many traders who join share market training in Nagpur learn that EMA is like the pulse of the market—it beats faster and gives quicker indications.
Strength of EMA
- Fast reaction
- Early signals
- Ideal for active trade setups
Weakness of EMA
- Too sensitive
- Can give false signals in sideways markets
If SMA is a calm teacher, EMA is a fast, young coach—it reacts quickly and keeps you alert.
6. Weighted Moving Average (WMA): The Balanced Approach
What is WMA?
The Weighted Moving Average assigns different weights to price points based on importance.
Unlike EMA, weights are assigned manually based on a formula.
WMA tries to offer a balance—more accurate than SMA but less reactive than EMA.
Why traders use WMA
Because it creates a balanced curve that reacts to price without becoming overly sensitive.
Where WMA is used
- Medium-term trading
- Systems that require a smoother yet responsive line
- Trend reliability analysis
Strength of WMA
- Balanced sensitivity
- Useful for identifying accurate zones
- Works well in trending markets
Weakness of WMA
- Slightly complex to calculate
- Less popular among beginners
WMA is like a smart middle path—neither too slow nor too fast.
7. Smoothed Moving Average (SMMA): The True Smooth Operator
What is SMMA?
The Smoothed Moving Average uses long-term price data and creates an extremely smooth line that filters out almost all noise.
It uses both old and new price data in a calculated manner.
Where SMMA works well
- Long-term trend analysis
- Forex markets
- Higher timeframes
- Investing decisions
Strength of SMMA
- Very smooth
- Great for larger trends
- Best for avoiding whipsaws
Weakness of SMMA
- Very slow
- Not useful for fast trading
SMMA is the wise old monk—focused, calm, and unshaken by market chaos.
8. Why Different Moving Averages Matter to Traders
Not all traders have the same mindset.
Some are aggressive, some conservative, some experimental.
Moving averages provide flexibility.
If you want slow, stable signals → Go for SMA or SMMA
If you want fast, responsive signals → Go for EMA or WMA
This flexibility is why moving averages become a central chapter in every stock market training program.
9. Key Moving Average Periods and Their Meaning
Different moving average lengths have different purposes.
Short-term MAs
- 5, 9, 10, 13, 20 periods
Used by intraday and scalping traders.
Medium-term MAs
- 30, 50 periods
Used for swing trading and intermediate trend analysis.
Long-term MAs
- 100, 150, 200 periods
Used for investors and position traders.
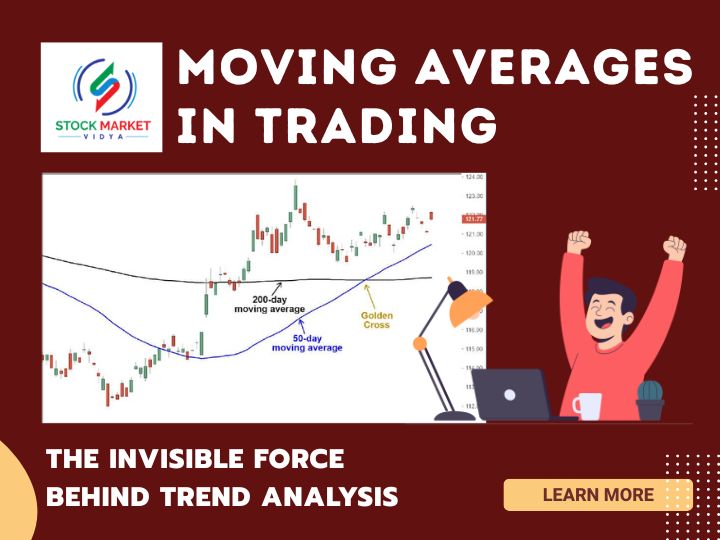
A long-term MA like 200-day SMA often acts as a major support or resistance.
This is why many traders depend on 200 SMA for identifying broader market sentiment.
10. Moving Averages as Support and Resistance
One of the most interesting roles of moving averages is their ability to act as dynamic support and resistance.
When price approaches an MA and reverses, traders understand that the average is respected.
Support example
Price retraces to 20 EMA and bounces upward → Uptrend continuation.
Resistance example
Price touches 50 SMA from below and falls → Downtrend continuation.
Such behaviour creates highly accurate trading levels, which are taught extensively in share trading classes in Nagpur.
11. Moving Average Crossovers: The Trader’s Secret Weapon
A crossover is when one moving average crosses another, creating a buy or sell signal.
Golden Cross
50 SMA crosses above 200 SMA → Bullish trend.
Death Cross
50 SMA crosses below 200 SMA → Bearish trend.
These crossover systems are widely used in:
- Swing trading
- Position trading
- Index analysis
- Portfolio management
Students who enroll in a share market course in Nagpur often find crossovers easy to understand and extremely practical.
12. Moving Averages for Intraday Trading
Intraday traders rely heavily on EMAs.
Popular combinations include:
- 9 EMA for momentum
- 20 EMA for trend confirmation
- 50 EMA for overall direction
Intraday traders use EMAs because they move fast and respond to every candle.
When price breaks above or below these EMAs with volume, strong opportunities emerge.
Professional share market training institute explain how intraday EMAs create rhythm and structure in fast markets.
13. Moving Averages for Swing Trading
Swing traders prefer a mix of SMA and EMA.
They often use:
These help identify:
- Trend continuation
- Pullback entries
- Breakout zones
Swing trading becomes easier when moving averages point in one direction and price remains above or below them.
14. Moving Averages in Options Trading
Options traders do not look at price alone—they follow momentum.
EMA-based strategies, especially 9 EMA and 20 EMA combinations, are common.
When momentum shifts, option buyers react faster, making EMAs extremely helpful.
15. Moving Averages in Long-term Investing
Long-term investors trust slow-moving averages like:
These create a long-term trend map.
If price is above 200 SMA, investors often feel comfortable holding their positions.
This is why moving averages appear in many professional stock market course modules.
16. Limitations of Moving Averages
While moving averages are useful, they also come with limitations:
- They lag behind price
- They cannot predict future movements
- They work poorly in sideways markets
- They give false signals during low volume
Understanding these limitations helps traders use moving averages wisely.
17. The Beauty of Moving Averages: Simplicity + Power
Moving averages are simple tools, but their effects are powerful.
They help beginners understand trend structure and help advanced traders refine their strategies.
Whether you are learning through share market training, practicing intraday setups, or building long-term portfolios, moving averages will always remain part of your journey.
They don’t promise perfection.
But they give clarity, which is all a trader needs.
18. Final Thoughts: Your Trading Journey with Moving Averages
Traders evolve through experience, but moving averages evolve with them.
They are simple enough for beginners and powerful enough for professionals.
If you are serious about learning how moving averages work in real charts, with live market examples, systematic strategies, and practical implementation, joining structured learning sessions becomes essential.
This is where Stock Market Vidya, Nagpur, led by Mr. Prashant Sarode (NISM Certified Trainer), helps learners transform their trading foundation.
Contact Stock Market Vidya, Nagpur
Mobile: 9822718163, 8421893845
Website:www.stockmarketvidya.com
[{"id":791,"link":"https:\/\/stockmarketvidya.com\/blogs\/george-soros-master-of-risk-and-reward\/","name":"george-soros-master-of-risk-and-reward","thumbnail":{"url":"https:\/\/stockmarketvidya.com\/blogs\/wp-content\/uploads\/2026\/03\/George-Soros.jpg","alt":"George Soros: Master of Risk and Reward"},"title":"George Soros: Master of Risk and Reward","author":{"name":"Share Market Blog","link":"https:\/\/stockmarketvidya.com\/blogs\/author\/share-market-blog\/"},"date":"Mar 23, 2026","dateGMT":"2026-03-23 01:05:00","modifiedDate":"2026-03-21 09:06:11","modifiedDateGMT":"2026-03-21 09:06:11","commentCount":"0","commentStatus":"open","categories":{"coma":"<a href=\"https:\/\/stockmarketvidya.com\/blogs\/category\/share-market\/\" rel=\"category tag\">Share Market<\/a>","space":"<a href=\"https:\/\/stockmarketvidya.com\/blogs\/category\/share-market\/\" rel=\"category tag\">Share Market<\/a>"},"taxonomies":{"post_tag":"<a href='https:\/\/stockmarketvidya.com\/blogs\/tag\/black-wednesday-george-soros\/' rel='post_tag'>Black Wednesday George Soros<\/a><a href='https:\/\/stockmarketvidya.com\/blogs\/tag\/george-soros-investing-style\/' rel='post_tag'>George Soros investing style<\/a><a href='https:\/\/stockmarketvidya.com\/blogs\/tag\/george-soros-trading-strategy\/' rel='post_tag'>George Soros trading strategy<\/a><a href='https:\/\/stockmarketvidya.com\/blogs\/tag\/risk-management-in-trading\/' rel='post_tag'>risk management in trading<\/a><a href='https:\/\/stockmarketvidya.com\/blogs\/tag\/stock-market-legends\/' rel='post_tag'>stock market legends<\/a><a href='https:\/\/stockmarketvidya.com\/blogs\/tag\/trading-psychology-lessons\/' rel='post_tag'>trading psychology lessons<\/a>"},"readTime":{"min":8,"sec":34},"status":"publish","excerpt":""},{"id":786,"link":"https:\/\/stockmarketvidya.com\/blogs\/sectoral-investing-identifying-growth-opportunities-in-the-stock-market\/","name":"sectoral-investing-identifying-growth-opportunities-in-the-stock-market","thumbnail":{"url":"https:\/\/stockmarketvidya.com\/blogs\/wp-content\/uploads\/2026\/03\/Sectoral-Investing.jpg","alt":"Sectoral Investing: Identifying Growth Opportunities in the Stock Market"},"title":"Sectoral Investing: Identifying Growth Opportunities in the Stock Market","author":{"name":"Share Market Blog","link":"https:\/\/stockmarketvidya.com\/blogs\/author\/share-market-blog\/"},"date":"Mar 21, 2026","dateGMT":"2026-03-21 06:10:47","modifiedDate":"2026-03-21 06:10:49","modifiedDateGMT":"2026-03-21 06:10:49","commentCount":"0","commentStatus":"open","categories":{"coma":"<a href=\"https:\/\/stockmarketvidya.com\/blogs\/category\/share-market\/\" rel=\"category tag\">Share Market<\/a>","space":"<a href=\"https:\/\/stockmarketvidya.com\/blogs\/category\/share-market\/\" rel=\"category tag\">Share Market<\/a>"},"taxonomies":{"post_tag":"<a href='https:\/\/stockmarketvidya.com\/blogs\/tag\/how-to-identify-strong-sectors\/' rel='post_tag'>how to identify strong sectors<\/a><a href='https:\/\/stockmarketvidya.com\/blogs\/tag\/option-trading-course-nagpur\/' rel='post_tag'>option trading course Nagpur<\/a><a href='https:\/\/stockmarketvidya.com\/blogs\/tag\/sector-rotation-strategy\/' rel='post_tag'>sector rotation strategy<\/a><a href='https:\/\/stockmarketvidya.com\/blogs\/tag\/sectoral-investing\/' rel='post_tag'>sectoral investing<\/a><a href='https:\/\/stockmarketvidya.com\/blogs\/tag\/share-market-classes-nagpur\/' rel='post_tag'>share market classes Nagpur<\/a><a href='https:\/\/stockmarketvidya.com\/blogs\/tag\/stock-market-course-nagpur\/' rel='post_tag'>Stock Market Course Nagpur<\/a><a href='https:\/\/stockmarketvidya.com\/blogs\/tag\/stock-market-sectors-india\/' rel='post_tag'>stock market sectors India<\/a><a href='https:\/\/stockmarketvidya.com\/blogs\/tag\/stock-market-training-nagpur\/' rel='post_tag'>stock market training Nagpur<\/a><a href='https:\/\/stockmarketvidya.com\/blogs\/tag\/technical-analysis-course-nagpur\/' rel='post_tag'>technical analysis course Nagpur<\/a>"},"readTime":{"min":9,"sec":26},"status":"publish","excerpt":""},{"id":776,"link":"https:\/\/stockmarketvidya.com\/blogs\/can-share-market-knowledge-help-students-in-future-careers-yes-heres-how\/","name":"can-share-market-knowledge-help-students-in-future-careers-yes-heres-how","thumbnail":{"url":"https:\/\/stockmarketvidya.com\/blogs\/wp-content\/uploads\/2026\/03\/Can-Share-Market-Knowledge-Help-Students-in-Future-Careers.jpg","alt":"Can Share Market Knowledge Help Students in Future Careers? Yes\u2014Here\u2019s How"},"title":"Can Share Market Knowledge Help Students in Future Careers? Yes\u2014Here\u2019s How","author":{"name":"Share Market Blog","link":"https:\/\/stockmarketvidya.com\/blogs\/author\/share-market-blog\/"},"date":"Mar 20, 2026","dateGMT":"2026-03-20 05:51:04","modifiedDate":"2026-03-20 06:13:46","modifiedDateGMT":"2026-03-20 06:13:46","commentCount":"0","commentStatus":"open","categories":{"coma":"<a href=\"https:\/\/stockmarketvidya.com\/blogs\/category\/share-market\/\" rel=\"category tag\">Share Market<\/a>","space":"<a href=\"https:\/\/stockmarketvidya.com\/blogs\/category\/share-market\/\" rel=\"category tag\">Share Market<\/a>"},"taxonomies":{"post_tag":"<a href='https:\/\/stockmarketvidya.com\/blogs\/tag\/best-trading-institute-in-nagpur\/' rel='post_tag'>best trading institute in Nagpur<\/a><a href='https:\/\/stockmarketvidya.com\/blogs\/tag\/intraday-trading-course-nagpur\/' rel='post_tag'>intraday trading course Nagpur<\/a><a href='https:\/\/stockmarketvidya.com\/blogs\/tag\/option-trading-course-nagpur\/' rel='post_tag'>option trading course Nagpur<\/a><a href='https:\/\/stockmarketvidya.com\/blogs\/tag\/share-market-course-in-nagpur\/' rel='post_tag'>Share Market Course in Nagpur<\/a><a href='https:\/\/stockmarketvidya.com\/blogs\/tag\/stock-market-classes-for-beginners\/' rel='post_tag'>stock market classes for beginners<\/a><a href='https:\/\/stockmarketvidya.com\/blogs\/tag\/stock-market-course-for-students\/' rel='post_tag'>stock market course for students<\/a><a href='https:\/\/stockmarketvidya.com\/blogs\/tag\/stock-market-training-nagpur\/' rel='post_tag'>stock market training Nagpur<\/a><a href='https:\/\/stockmarketvidya.com\/blogs\/tag\/technical-analysis-course-nagpur\/' rel='post_tag'>technical analysis course Nagpur<\/a>"},"readTime":{"min":9,"sec":12},"status":"publish","excerpt":""},{"id":769,"link":"https:\/\/stockmarketvidya.com\/blogs\/developing-a-winning-trading-mindset-the-secret-behind-successful-traders-in-the-stock-market\/","name":"developing-a-winning-trading-mindset-the-secret-behind-successful-traders-in-the-stock-market","thumbnail":{"url":"https:\/\/stockmarketvidya.com\/blogs\/wp-content\/uploads\/2026\/03\/Developing-a-Winning-Trading-Mindset-1.png","alt":"Developing a Winning Trading Mindset: The Secret Behind Successful Traders in the Stock Market"},"title":"Developing a Winning Trading Mindset: The Secret Behind Successful Traders in the Stock Market","author":{"name":"Share Market Blog","link":"https:\/\/stockmarketvidya.com\/blogs\/author\/share-market-blog\/"},"date":"Mar 14, 2026","dateGMT":"2026-03-14 01:00:00","modifiedDate":"2026-03-21 07:03:43","modifiedDateGMT":"2026-03-21 07:03:43","commentCount":"0","commentStatus":"open","categories":{"coma":"<a href=\"https:\/\/stockmarketvidya.com\/blogs\/category\/share-market\/\" rel=\"category tag\">Share Market<\/a>, <a href=\"https:\/\/stockmarketvidya.com\/blogs\/category\/share-market-course\/\" rel=\"category tag\">Share Market Course<\/a>","space":"<a href=\"https:\/\/stockmarketvidya.com\/blogs\/category\/share-market\/\" rel=\"category tag\">Share Market<\/a> <a href=\"https:\/\/stockmarketvidya.com\/blogs\/category\/share-market-course\/\" rel=\"category tag\">Share Market Course<\/a>"},"taxonomies":{"post_tag":"<a href='https:\/\/stockmarketvidya.com\/blogs\/tag\/emotional-trading-control\/' rel='post_tag'>emotional trading control<\/a><a href='https:\/\/stockmarketvidya.com\/blogs\/tag\/intraday-trading-mindset\/' rel='post_tag'>intraday trading mindset<\/a><a href='https:\/\/stockmarketvidya.com\/blogs\/tag\/learn-trading-in-nagpur\/' rel='post_tag'>Learn Trading in Nagpur<\/a><a href='https:\/\/stockmarketvidya.com\/blogs\/tag\/share-market-course-nagpur\/' rel='post_tag'>share market course Nagpur<\/a><a href='https:\/\/stockmarketvidya.com\/blogs\/tag\/stock-market-classes-nagpur\/' rel='post_tag'>Stock market classes Nagpur<\/a><a href='https:\/\/stockmarketvidya.com\/blogs\/tag\/stock-market-psychology\/' rel='post_tag'>stock market psychology<\/a><a href='https:\/\/stockmarketvidya.com\/blogs\/tag\/technical-analysis-course-nagpur\/' rel='post_tag'>technical analysis course Nagpur<\/a>"},"readTime":{"min":15,"sec":42},"status":"publish","excerpt":""},{"id":766,"link":"https:\/\/stockmarketvidya.com\/blogs\/how-dividends-work-earn-passive-income-from-shares-in-the-indian-stock-market\/","name":"how-dividends-work-earn-passive-income-from-shares-in-the-indian-stock-market","thumbnail":{"url":"https:\/\/stockmarketvidya.com\/blogs\/wp-content\/uploads\/2026\/03\/How-Dividends-Work.jpg","alt":"How Dividends Work: Earn Passive Income from Shares in the Indian Stock Market"},"title":"How Dividends Work: Earn Passive Income from Shares in the Indian Stock Market","author":{"name":"Share Market Blog","link":"https:\/\/stockmarketvidya.com\/blogs\/author\/share-market-blog\/"},"date":"Mar 13, 2026","dateGMT":"2026-03-13 07:12:26","modifiedDate":"2026-03-13 07:12:28","modifiedDateGMT":"2026-03-13 07:12:28","commentCount":"0","commentStatus":"open","categories":{"coma":"<a href=\"https:\/\/stockmarketvidya.com\/blogs\/category\/share-market\/\" rel=\"category tag\">Share Market<\/a>, <a href=\"https:\/\/stockmarketvidya.com\/blogs\/category\/share-market-course\/\" rel=\"category tag\">Share Market Course<\/a>","space":"<a href=\"https:\/\/stockmarketvidya.com\/blogs\/category\/share-market\/\" rel=\"category tag\">Share Market<\/a> <a href=\"https:\/\/stockmarketvidya.com\/blogs\/category\/share-market-course\/\" rel=\"category tag\">Share Market Course<\/a>"},"taxonomies":{"post_tag":"<a href='https:\/\/stockmarketvidya.com\/blogs\/tag\/dividend-investing\/' rel='post_tag'>dividend investing<\/a><a href='https:\/\/stockmarketvidya.com\/blogs\/tag\/dividend-stocks-india\/' rel='post_tag'>dividend stocks India<\/a><a href='https:\/\/stockmarketvidya.com\/blogs\/tag\/financial-investing-india\/' rel='post_tag'>financial investing India<\/a><a href='https:\/\/stockmarketvidya.com\/blogs\/tag\/long-term-investing-2\/' rel='post_tag'>long term investing<\/a><a href='https:\/\/stockmarketvidya.com\/blogs\/tag\/passive-income-from-shares\/' rel='post_tag'>passive income from shares<\/a><a href='https:\/\/stockmarketvidya.com\/blogs\/tag\/portfolio-income-investing\/' rel='post_tag'>portfolio income investing<\/a><a href='https:\/\/stockmarketvidya.com\/blogs\/tag\/stock-market-beginners\/' rel='post_tag'>stock market beginners<\/a><a href='https:\/\/stockmarketvidya.com\/blogs\/tag\/stock-market-education\/' rel='post_tag'>Stock market education<\/a><a href='https:\/\/stockmarketvidya.com\/blogs\/tag\/wealth-creation-through-stocks\/' rel='post_tag'>wealth creation through stocks<\/a>"},"readTime":{"min":15,"sec":46},"status":"publish","excerpt":""},{"id":758,"link":"https:\/\/stockmarketvidya.com\/blogs\/small-cap-vs-mid-cap-vs-large-cap-stocks-where-should-smart-investors-in-nagpur-invest\/","name":"small-cap-vs-mid-cap-vs-large-cap-stocks-where-should-smart-investors-in-nagpur-invest","thumbnail":{"url":"https:\/\/stockmarketvidya.com\/blogs\/wp-content\/uploads\/2026\/03\/Small-Cap-vs-Mid-Cap-vs-Large-Cap-Stocks.jpg","alt":"Small Cap vs Mid Cap vs Large Cap Stocks: Where Should Smart Investors in Nagpur Invest?"},"title":"Small Cap vs Mid Cap vs Large Cap Stocks: Where Should Smart Investors in Nagpur Invest?","author":{"name":"Share Market Blog","link":"https:\/\/stockmarketvidya.com\/blogs\/author\/share-market-blog\/"},"date":"Mar 6, 2026","dateGMT":"2026-03-06 01:00:00","modifiedDate":"2026-03-04 11:33:11","modifiedDateGMT":"2026-03-04 11:33:11","commentCount":"0","commentStatus":"open","categories":{"coma":"<a href=\"https:\/\/stockmarketvidya.com\/blogs\/category\/share-market\/\" rel=\"category tag\">Share Market<\/a>, <a href=\"https:\/\/stockmarketvidya.com\/blogs\/category\/share-market-course\/\" rel=\"category tag\">Share Market Course<\/a>","space":"<a href=\"https:\/\/stockmarketvidya.com\/blogs\/category\/share-market\/\" rel=\"category tag\">Share Market<\/a> <a href=\"https:\/\/stockmarketvidya.com\/blogs\/category\/share-market-course\/\" rel=\"category tag\">Share Market Course<\/a>"},"taxonomies":{"post_tag":"<a href='https:\/\/stockmarketvidya.com\/blogs\/tag\/difference-between-small-mid-large-cap\/' rel='post_tag'>difference between small mid large cap<\/a><a href='https:\/\/stockmarketvidya.com\/blogs\/tag\/equity-investment-guide\/' rel='post_tag'>equity investment guide<\/a><a href='https:\/\/stockmarketvidya.com\/blogs\/tag\/investment-strategy-india-portfolio-diversification\/' rel='post_tag'>investment strategy India portfolio diversification<\/a><a href='https:\/\/stockmarketvidya.com\/blogs\/tag\/market-capitalization-explained\/' rel='post_tag'>market capitalization explained<\/a><a href='https:\/\/stockmarketvidya.com\/blogs\/tag\/market-cycles-investing\/' rel='post_tag'>market cycles investing<\/a><a href='https:\/\/stockmarketvidya.com\/blogs\/tag\/nifty-midcap-150\/' rel='post_tag'>NIFTY Midcap 150<\/a><a href='https:\/\/stockmarketvidya.com\/blogs\/tag\/nifty-smallcap-250\/' rel='post_tag'>NIFTY Smallcap 250<\/a><a href='https:\/\/stockmarketvidya.com\/blogs\/tag\/risk-management-in-stock-market-long-term-investing-india\/' rel='post_tag'>risk management in stock market long term investing India<\/a><a href='https:\/\/stockmarketvidya.com\/blogs\/tag\/sebi-stock-classification\/' rel='post_tag'>SEBI stock classification<\/a><a href='https:\/\/stockmarketvidya.com\/blogs\/tag\/share-market-classes-nagpur\/' rel='post_tag'>share market classes Nagpur<\/a><a href='https:\/\/stockmarketvidya.com\/blogs\/tag\/share-trading-classes-nagpur\/' rel='post_tag'>Share Trading Classes Nagpur<\/a><a href='https:\/\/stockmarketvidya.com\/blogs\/tag\/stock-market-course-nagpur\/' rel='post_tag'>Stock Market Course Nagpur<\/a><a href='https:\/\/stockmarketvidya.com\/blogs\/tag\/stock-market-training-nagpur\/' rel='post_tag'>stock market training Nagpur<\/a><a href='https:\/\/stockmarketvidya.com\/blogs\/tag\/stock-market-vidya\/' rel='post_tag'>Stock Market Vidya<\/a>"},"readTime":{"min":9,"sec":59},"status":"publish","excerpt":""},{"id":760,"link":"https:\/\/stockmarketvidya.com\/blogs\/stock-exchanges-explained-in-simple-words-nse-vs-bse-which-one-matters-for-you-as-a-trader\/","name":"stock-exchanges-explained-in-simple-words-nse-vs-bse-which-one-matters-for-you-as-a-trader","thumbnail":{"url":"https:\/\/stockmarketvidya.com\/blogs\/wp-content\/uploads\/2026\/03\/NSE-vs-BSE.jpg","alt":"Stock Exchanges Explained in Simple Words: NSE vs BSE \u2013 Which One Matters for You as a Trader?"},"title":"Stock Exchanges Explained in Simple Words: NSE vs BSE \u2013 Which One Matters for You as a Trader?","author":{"name":"Share Market Blog","link":"https:\/\/stockmarketvidya.com\/blogs\/author\/share-market-blog\/"},"date":"Mar 4, 2026","dateGMT":"2026-03-04 10:54:30","modifiedDate":"2026-03-04 10:54:31","modifiedDateGMT":"2026-03-04 10:54:31","commentCount":"0","commentStatus":"open","categories":{"coma":"<a href=\"https:\/\/stockmarketvidya.com\/blogs\/category\/share-market\/\" rel=\"category tag\">Share Market<\/a>, <a href=\"https:\/\/stockmarketvidya.com\/blogs\/category\/share-market-course\/\" rel=\"category tag\">Share Market Course<\/a>","space":"<a href=\"https:\/\/stockmarketvidya.com\/blogs\/category\/share-market\/\" rel=\"category tag\">Share Market<\/a> <a href=\"https:\/\/stockmarketvidya.com\/blogs\/category\/share-market-course\/\" rel=\"category tag\">Share Market Course<\/a>"},"taxonomies":{"post_tag":"<a href='https:\/\/stockmarketvidya.com\/blogs\/tag\/equity-market-india\/' rel='post_tag'>equity market India<\/a><a href='https:\/\/stockmarketvidya.com\/blogs\/tag\/futures-and-options-nse\/' rel='post_tag'>Futures and Options NSE<\/a><a href='https:\/\/stockmarketvidya.com\/blogs\/tag\/market-depth-analysis\/' rel='post_tag'>market depth analysis<\/a><a href='https:\/\/stockmarketvidya.com\/blogs\/tag\/order-matching-system\/' rel='post_tag'>order matching system<\/a><a href='https:\/\/stockmarketvidya.com\/blogs\/tag\/share-market-course-nagpur\/' rel='post_tag'>share market course Nagpur<\/a><a href='https:\/\/stockmarketvidya.com\/blogs\/tag\/share-trading-classes-nagpur\/' rel='post_tag'>Share Trading Classes Nagpur<\/a><a href='https:\/\/stockmarketvidya.com\/blogs\/tag\/stock-market-basics\/' rel='post_tag'>stock market basics<\/a><a href='https:\/\/stockmarketvidya.com\/blogs\/tag\/stock-market-for-beginners\/' rel='post_tag'>Stock market for beginners<\/a><a href='https:\/\/stockmarketvidya.com\/blogs\/tag\/stock-market-training-nagpur\/' rel='post_tag'>stock market training Nagpur<\/a><a href='https:\/\/stockmarketvidya.com\/blogs\/tag\/stock-market-vidya-nagpur\/' rel='post_tag'>Stock Market Vidya Nagpur<\/a><a href='https:\/\/stockmarketvidya.com\/blogs\/tag\/t1-settlement-cycle\/' rel='post_tag'>T+1 settlement cycle<\/a><a href='https:\/\/stockmarketvidya.com\/blogs\/tag\/trading-education-india\/' rel='post_tag'>trading education india<\/a>"},"readTime":{"min":11,"sec":24},"status":"publish","excerpt":""},{"id":744,"link":"https:\/\/stockmarketvidya.com\/blogs\/etf-is-the-smartest-investment-choice-today-a-practical-guide-for-modern-investors\/","name":"etf-is-the-smartest-investment-choice-today-a-practical-guide-for-modern-investors","thumbnail":{"url":"https:\/\/stockmarketvidya.com\/blogs\/wp-content\/uploads\/2026\/02\/ETF-Is-the-Smartest-Investment-Choice-Today-2.jpg","alt":""},"title":"ETF Is the Smartest Investment Choice Today \u2013 A Practical Guide for Modern Investors","author":{"name":"Share Market Blog","link":"https:\/\/stockmarketvidya.com\/blogs\/author\/share-market-blog\/"},"date":"Feb 26, 2026","dateGMT":"2026-02-26 12:29:32","modifiedDate":"2026-02-26 12:30:23","modifiedDateGMT":"2026-02-26 12:30:23","commentCount":"0","commentStatus":"open","categories":{"coma":"<a href=\"https:\/\/stockmarketvidya.com\/blogs\/category\/share-market\/\" rel=\"category tag\">Share Market<\/a>","space":"<a href=\"https:\/\/stockmarketvidya.com\/blogs\/category\/share-market\/\" rel=\"category tag\">Share Market<\/a>"},"taxonomies":{"post_tag":""},"readTime":{"min":10,"sec":51},"status":"publish","excerpt":""},{"id":739,"link":"https:\/\/stockmarketvidya.com\/blogs\/short-strangle-strategy-in-a-sideways-market\/","name":"short-strangle-strategy-in-a-sideways-market","thumbnail":{"url":"https:\/\/stockmarketvidya.com\/blogs\/wp-content\/uploads\/2026\/02\/Short-Strangle-Strategy-in-a-marketing-Experts.png","alt":"Short Strangle Strategy in a Sideways Market"},"title":"Short Strangle Strategy in a Sideways Market","author":{"name":"Share Market Blog","link":"https:\/\/stockmarketvidya.com\/blogs\/author\/share-market-blog\/"},"date":"Feb 22, 2026","dateGMT":"2026-02-22 01:00:00","modifiedDate":"2026-02-20 07:38:34","modifiedDateGMT":"2026-02-20 07:38:34","commentCount":"0","commentStatus":"open","categories":{"coma":"<a href=\"https:\/\/stockmarketvidya.com\/blogs\/category\/share-market\/\" rel=\"category tag\">Share Market<\/a>, <a href=\"https:\/\/stockmarketvidya.com\/blogs\/category\/share-market-course\/\" rel=\"category tag\">Share Market Course<\/a>","space":"<a href=\"https:\/\/stockmarketvidya.com\/blogs\/category\/share-market\/\" rel=\"category tag\">Share Market<\/a> <a href=\"https:\/\/stockmarketvidya.com\/blogs\/category\/share-market-course\/\" rel=\"category tag\">Share Market Course<\/a>"},"taxonomies":{"post_tag":""},"readTime":{"min":9,"sec":24},"status":"publish","excerpt":""},{"id":734,"link":"https:\/\/stockmarketvidya.com\/blogs\/buy-strangle-strategy-in-a-volatile-market-how-smart-traders-profit-from-big-price-moves\/","name":"buy-strangle-strategy-in-a-volatile-market-how-smart-traders-profit-from-big-price-moves","thumbnail":{"url":"https:\/\/stockmarketvidya.com\/blogs\/wp-content\/uploads\/2026\/02\/Buy-Strangle-Strategy-in-a-Volatile-Market.jpg","alt":"Buy Strangle Strategy in a Volatile Market: How Smart Traders Profit from Big Price Moves"},"title":"Buy Strangle Strategy in a Volatile Market: How Smart Traders Profit from Big Price Moves","author":{"name":"Share Market Blog","link":"https:\/\/stockmarketvidya.com\/blogs\/author\/share-market-blog\/"},"date":"Feb 20, 2026","dateGMT":"2026-02-20 06:36:50","modifiedDate":"2026-02-20 06:36:52","modifiedDateGMT":"2026-02-20 06:36:52","commentCount":"0","commentStatus":"open","categories":{"coma":"<a href=\"https:\/\/stockmarketvidya.com\/blogs\/category\/share-market\/\" rel=\"category tag\">Share Market<\/a>, <a href=\"https:\/\/stockmarketvidya.com\/blogs\/category\/share-market-course\/\" rel=\"category tag\">Share Market Course<\/a>","space":"<a href=\"https:\/\/stockmarketvidya.com\/blogs\/category\/share-market\/\" rel=\"category tag\">Share Market<\/a> <a href=\"https:\/\/stockmarketvidya.com\/blogs\/category\/share-market-course\/\" rel=\"category tag\">Share Market Course<\/a>"},"taxonomies":{"post_tag":""},"readTime":{"min":8,"sec":20},"status":"publish","excerpt":""},{"id":727,"link":"https:\/\/stockmarketvidya.com\/blogs\/short-straddle-in-sideways-market-a-complete-traders-perspective\/","name":"short-straddle-in-sideways-market-a-complete-traders-perspective","thumbnail":{"url":"https:\/\/stockmarketvidya.com\/blogs\/wp-content\/uploads\/2026\/02\/Short-Straddle-in-Sideways-Market.jpg","alt":"Short Straddle in Sideways Market: A Complete Trader\u2019s Perspective"},"title":"Short Straddle in Sideways Market: A Complete Trader\u2019s Perspective","author":{"name":"Share Market Blog","link":"https:\/\/stockmarketvidya.com\/blogs\/author\/share-market-blog\/"},"date":"Feb 13, 2026","dateGMT":"2026-02-13 01:55:00","modifiedDate":"2026-02-11 06:28:05","modifiedDateGMT":"2026-02-11 06:28:05","commentCount":"0","commentStatus":"open","categories":{"coma":"<a href=\"https:\/\/stockmarketvidya.com\/blogs\/category\/share-market\/\" rel=\"category tag\">Share Market<\/a>","space":"<a href=\"https:\/\/stockmarketvidya.com\/blogs\/category\/share-market\/\" rel=\"category tag\">Share Market<\/a>"},"taxonomies":{"post_tag":"<a href='https:\/\/stockmarketvidya.com\/blogs\/tag\/bank-nifty-option-selling-strategy\/' rel='post_tag'>BANK NIFTY option selling strategy<\/a><a href='https:\/\/stockmarketvidya.com\/blogs\/tag\/best-share-market-classes-in-nagpur\/' rel='post_tag'>Best share market classes in Nagpur<\/a><a href='https:\/\/stockmarketvidya.com\/blogs\/tag\/expiry-day-trading-strategy\/' rel='post_tag'>expiry day trading strategy<\/a><a href='https:\/\/stockmarketvidya.com\/blogs\/tag\/nifty-short-straddle\/' rel='post_tag'>NIFTY Short Straddle<\/a><a href='https:\/\/stockmarketvidya.com\/blogs\/tag\/nism-certified-trainer-nagpur\/' rel='post_tag'>NISM Certified Trainer Nagpur<\/a><a href='https:\/\/stockmarketvidya.com\/blogs\/tag\/non-directional-options-strategy\/' rel='post_tag'>Non Directional Options Strategy<\/a><a href='https:\/\/stockmarketvidya.com\/blogs\/tag\/option-selling-course-nagpur\/' rel='post_tag'>option selling course Nagpur<\/a><a href='https:\/\/stockmarketvidya.com\/blogs\/tag\/option-selling-strategy\/' rel='post_tag'>option selling strategy<\/a><a href='https:\/\/stockmarketvidya.com\/blogs\/tag\/options-trading-for-beginners\/' rel='post_tag'>Options trading for beginners<\/a><a href='https:\/\/stockmarketvidya.com\/blogs\/tag\/premium-decay-strategy\/' rel='post_tag'>premium decay strategy<\/a><a href='https:\/\/stockmarketvidya.com\/blogs\/tag\/professional-stock-market-training\/' rel='post_tag'>professional stock market training<\/a><a href='https:\/\/stockmarketvidya.com\/blogs\/tag\/range-bound-market-strategy\/' rel='post_tag'>range bound market strategy<\/a><a href='https:\/\/stockmarketvidya.com\/blogs\/tag\/share-market-classes-in-nagpur\/' rel='post_tag'>Share Market Classes in Nagpur<\/a><a href='https:\/\/stockmarketvidya.com\/blogs\/tag\/share-market-training-in-nagpur\/' rel='post_tag'>share market training in Nagpur<\/a><a href='https:\/\/stockmarketvidya.com\/blogs\/tag\/short-straddle-in-sideways-market\/' rel='post_tag'>Short Straddle in sideways market<\/a><a href='https:\/\/stockmarketvidya.com\/blogs\/tag\/short-straddle-strategy\/' rel='post_tag'>Short Straddle strategy<\/a><a href='https:\/\/stockmarketvidya.com\/blogs\/tag\/sideways-market-trading-strategy\/' rel='post_tag'>sideways market trading strategy<\/a><a href='https:\/\/stockmarketvidya.com\/blogs\/tag\/stock-market-course-near-me\/' rel='post_tag'>stock market course near me<\/a><a href='https:\/\/stockmarketvidya.com\/blogs\/tag\/stock-market-vidya-nagpur\/' rel='post_tag'>Stock Market Vidya Nagpur<\/a><a href='https:\/\/stockmarketvidya.com\/blogs\/tag\/time-decay-trading-strategy\/' rel='post_tag'>time decay trading strategy<\/a><a href='https:\/\/stockmarketvidya.com\/blogs\/tag\/volatility-based-option-selling\/' rel='post_tag'>volatility based option selling<\/a>"},"readTime":{"min":8,"sec":31},"status":"publish","excerpt":""},{"id":720,"link":"https:\/\/stockmarketvidya.com\/blogs\/buy-straddle-strategy-in-a-volatile-market-how-smart-traders-trade-big-moves-without-predicting-direction\/","name":"buy-straddle-strategy-in-a-volatile-market-how-smart-traders-trade-big-moves-without-predicting-direction","thumbnail":{"url":"https:\/\/stockmarketvidya.com\/blogs\/wp-content\/uploads\/2026\/02\/Buy-Straddle-Strategy-in-a-Volatile-Market.jpg","alt":"Buy Straddle Strategy in a Volatile Market: How Smart Traders Trade Big Moves Without Predicting Direction"},"title":"Buy Straddle Strategy in a Volatile Market: How Smart Traders Trade Big Moves Without Predicting Direction","author":{"name":"Share Market Blog","link":"https:\/\/stockmarketvidya.com\/blogs\/author\/share-market-blog\/"},"date":"Feb 11, 2026","dateGMT":"2026-02-11 05:52:31","modifiedDate":"2026-02-11 06:39:48","modifiedDateGMT":"2026-02-11 06:39:48","commentCount":"1","commentStatus":"open","categories":{"coma":"<a href=\"https:\/\/stockmarketvidya.com\/blogs\/category\/share-market\/\" rel=\"category tag\">Share Market<\/a>","space":"<a href=\"https:\/\/stockmarketvidya.com\/blogs\/category\/share-market\/\" rel=\"category tag\">Share Market<\/a>"},"taxonomies":{"post_tag":"<a href='https:\/\/stockmarketvidya.com\/blogs\/tag\/banknifty-straddle-strategy\/' rel='post_tag'>BANKNIFTY straddle strategy<\/a><a href='https:\/\/stockmarketvidya.com\/blogs\/tag\/best-share-market-classes-in-nagpur\/' rel='post_tag'>Best share market classes in Nagpur<\/a><a href='https:\/\/stockmarketvidya.com\/blogs\/tag\/buy-straddle-in-volatile-market\/' rel='post_tag'>Buy Straddle in volatile market<\/a><a href='https:\/\/stockmarketvidya.com\/blogs\/tag\/buy-straddle-strategy\/' rel='post_tag'>Buy Straddle strategy<\/a><a href='https:\/\/stockmarketvidya.com\/blogs\/tag\/direction-neutral-trading-strategy\/' rel='post_tag'>direction neutral trading strategy<\/a><a href='https:\/\/stockmarketvidya.com\/blogs\/tag\/event-based-trading\/' rel='post_tag'>event based trading<\/a><a href='https:\/\/stockmarketvidya.com\/blogs\/tag\/how-to-trade-straddle\/' rel='post_tag'>how to trade straddle<\/a><a href='https:\/\/stockmarketvidya.com\/blogs\/tag\/intraday-options-strategy\/' rel='post_tag'>intraday options strategy<\/a><a href='https:\/\/stockmarketvidya.com\/blogs\/tag\/nifty-options-strategy\/' rel='post_tag'>Nifty Options Strategy<\/a><a href='https:\/\/stockmarketvidya.com\/blogs\/tag\/nism-certified-trainer-nagpur\/' rel='post_tag'>NISM Certified Trainer Nagpur<\/a><a href='https:\/\/stockmarketvidya.com\/blogs\/tag\/options-trading-course-nagpur\/' rel='post_tag'>options trading course Nagpur<\/a><a href='https:\/\/stockmarketvidya.com\/blogs\/tag\/options-trading-for-beginners\/' rel='post_tag'>Options trading for beginners<\/a><a href='https:\/\/stockmarketvidya.com\/blogs\/tag\/options-trading-strategy\/' rel='post_tag'>Options trading strategy<\/a><a href='https:\/\/stockmarketvidya.com\/blogs\/tag\/risk-management-in-options-trading\/' rel='post_tag'>risk management in options trading<\/a><a href='https:\/\/stockmarketvidya.com\/blogs\/tag\/share-market-classes-in-nagpur\/' rel='post_tag'>Share Market Classes in Nagpur<\/a><a href='https:\/\/stockmarketvidya.com\/blogs\/tag\/share-market-training-in-nagpur\/' rel='post_tag'>share market training in Nagpur<\/a><a href='https:\/\/stockmarketvidya.com\/blogs\/tag\/stock-market-course-near-me\/' rel='post_tag'>stock market course near me<\/a><a href='https:\/\/stockmarketvidya.com\/blogs\/tag\/stock-market-vidya-nagpur\/' rel='post_tag'>Stock Market Vidya Nagpur<\/a><a href='https:\/\/stockmarketvidya.com\/blogs\/tag\/volatility-based-trading\/' rel='post_tag'>volatility based trading<\/a><a href='https:\/\/stockmarketvidya.com\/blogs\/tag\/volatility-trading-strategy\/' rel='post_tag'>volatility trading strategy<\/a>"},"readTime":{"min":8,"sec":47},"status":"publish","excerpt":""}]