
Presented by Stock Market Vidya, Nagpur – Learn from the Experts at the Best Share Market Classes in Nagpur
When traders talk about technical analysis, one of the first tools that often enters the conversation is the trend line. It’s simple to draw but powerful in application. From intraday players to long-term investors, understanding how to draw and use trend lines can transform the way you read the stock market.
At Stock Market Vidya Nagpur, a leading share market training institute in Nagpur run by Mr. Prashant Sarode, we believe in simplifying trading concepts for every learner. Whether you’re a newcomer or someone looking to strengthen your technical base, grasping trend lines is an essential step in mastering market psychology.
So, let’s deep-dive into the world of trend lines – not just what they are, but how they act like a compass for your trading decisions.
What Exactly is a Trend Line?
Imagine you’re hiking a mountain trail. A rope tied from one tree to another helps you stay on course. In stock trading, a trend line is that rope — visually guiding you through the market’s highs and lows.
A trend line is a straight line that connects two or more price points on a chart, helping identify the general direction of a stock or index — upward, downward, or sideways.
But it’s more than just a line. It’s the heartbeat of price action.
The Psychology Behind Trend Lines
Each candlestick on a chart tells a story of human behavior – of fear, greed, hope, and doubt. Trend lines help us visualize that behavior.
- Uptrend Lines reflect a market full of optimism where buyers are in control.
- Downtrend Lines signal fear and selling pressure, showing that sellers are winning.
- Sideways Trends often indicate confusion or market indecision.
Understanding trend lines is like reading emotions without words — and that skill is invaluable for any trader.
Why Every Smart Trader Swears by Trend Lines
In the stock market course at Stock Market Vidya, we teach that trend lines do more than show direction. Here’s why they are respected:
- Trend Confirmation: Before jumping into any trade, confirming the trend is a must. A single trend line helps you align your trades with market direction.
- Entry and Exit Clarity: Knowing when to get in and when to get out is half the game. Trend lines provide strategic zones for entry and exit.
- Support and Resistance: They act like invisible fences. In an uptrend, the trend line becomes a support. In a downtrend, it becomes resistance.
- Risk Management Tool: You can place stop-losses just below or above trend lines, reducing your exposure.
These points are core to any share market course that takes trading seriously.
Drawing the Perfect Trend Line — The Golden Rules
Anyone can draw a line, but only trained eyes draw accurate trend lines. Here’s what every trader must follow:
- Minimum Two Points: A valid trend line must connect at least two swing lows (for an uptrend) or swing highs (for a downtrend).
- Respect the Wick: Use candlestick wicks to find real market reactions.
- Avoid Forcing the Line: If the price doesn’t align naturally, don’t bend the rules to make it fit. Let the market guide you.
- More Touches = More Power: The more times price respects a trend line, the stronger it becomes.
- Zoom Out: On daily charts, trend lines hold more value than those drawn on a 5-minute timeframe.
This is part of the hands-on learning offered in our share market classes at Nagpur — where theory meets real charts.
Types of Trend Lines and When to Use Them
At Stock Market Vidya, we break down trend lines into practical categories so learners know when and how to use them:
1. Uptrend Line (Rising Support)
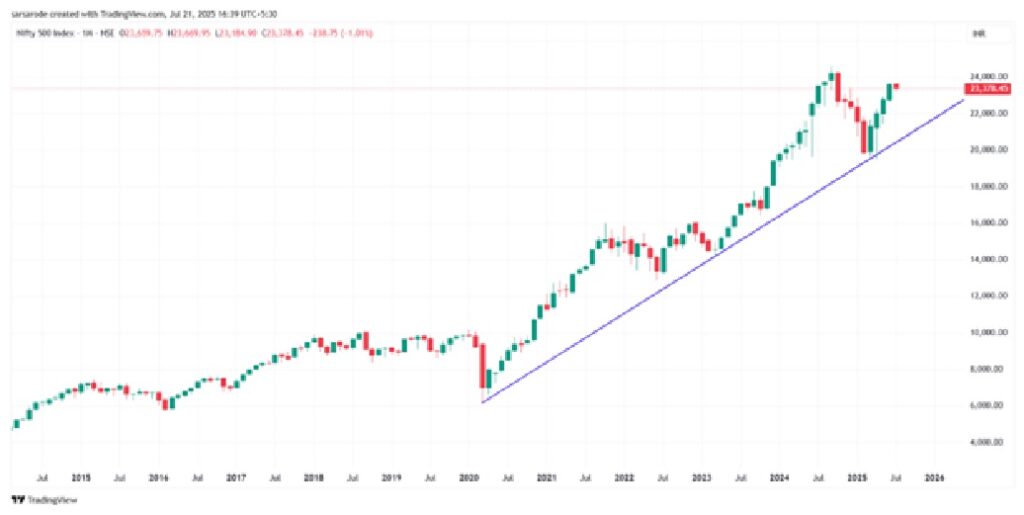
- Connects higher lows.
- Indicates bullish sentiment.
- Use it to spot continuation patterns.
2. Downtrend Line (Falling Resistance)
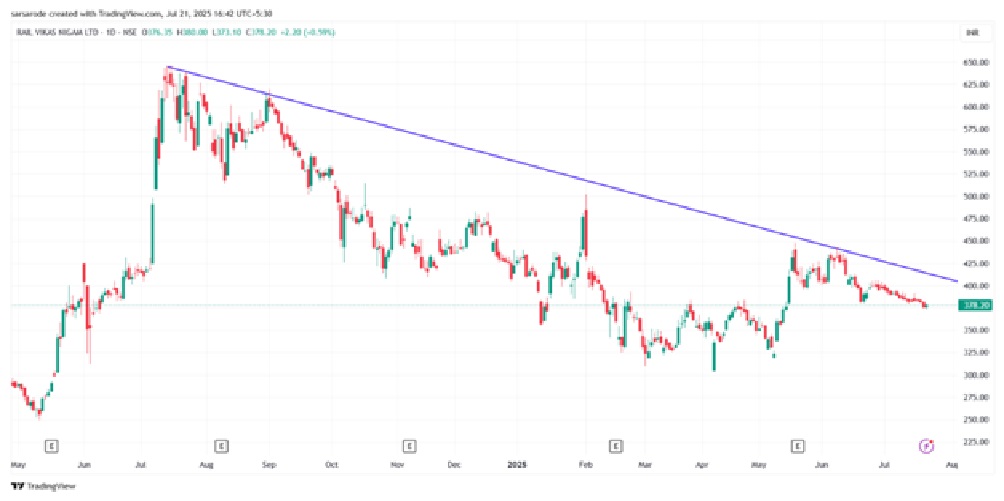
- Connects lower highs.
- Reflects bearish control.
- Breakout above may signal trend reversal.
3. Channel Lines
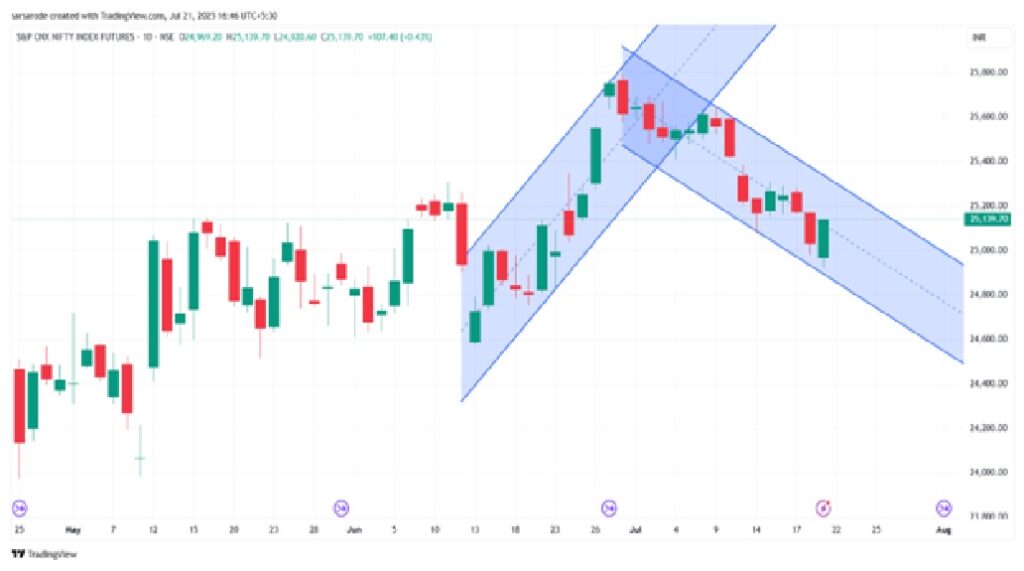
- These are parallel lines that define both support and resistance in a trending market.
- Channels offer dual opportunities: trade the bounce or wait for the breakout.
4. Steep vs. Shallow Trend Lines
- Steep trend lines often break quickly.
- Shallow trend lines last longer and show gradual, sustainable trends.
Knowing these types and when to apply them is part of our stock market training methodology.
Real-Life Examples of Trend Line Breakouts
When a trend line is broken, it’s like a bridge collapsing — something has fundamentally shifted. A breakout can signal:
- Reversal of the existing trend
- Acceleration of momentum
- Start of a sideways market
But beware — fake breakouts are common. That’s were combining trend lines with volume or other indicators (like RSI or MACD) is taught in our stock market course in Nagpur. You don’t just learn patterns; you learn how to verify them.
When Trend Lines Fail — And Why That’s Also a Signal
Trend lines are powerful, but not foolproof. If you see consistent breaches without recovery, it’s a signal to rethink your analysis.
Reasons trend lines may fail:
- Market News or Events
- Sudden Shifts in Sentiment
- Low Volume
At Stock Market Vidya Nagpur, we train students not just to depend on tools — but to think like traders. It’s this mindset that sets us apart as one of the best share market classes in Nagpur.
Advanced Trend Line Tricks — Beyond the Basics
Once you’ve got the hang of classic trend lines, it’s time to move ahead:
- Multiple Timeframe Analysis
- Draw trend lines on higher timeframes (like weekly) and then trade on lower ones (like hourly). It adds precision.
- Using Trend Lines with Fibonacci
- When trend lines intersect with Fibonacci levels, the zone becomes a high-probability area for entry.
- Trend Line Break and Retest
- Smart traders wait for the price to break a trend line and then retest it before entering. This minimizes false signals.
We include such advanced strategies in our share market training programs, making learners market-ready.
How You Can Learn This with Clarity and Confidence
If you’ve ever looked at a chart and felt lost, trend lines will give you structure.
But learning alone from YouTube videos isn’t always enough. That’s where structured training from Stock Market Vidya Nagpur comes in.
- Hands-on practice with live charts
- Step-by-step guidance on trend line mastery
- Mentorship by experienced trainers
By enrolling in our share market course, you learn not just how to draw — but how to interpret, act, and trade with trend lines confidently.
Final Thoughts — Draw That Line and Draw Confidence
Trend lines are not just for charting. They build a trader’s confidence, discipline, and clarity. They turn chaos into strategy. Whether you are into positional trading, swing trading, or intraday, trend lines are your loyal companions.
And if you’re looking to learn this from the ground up — from basics to advanced application — there’s no better place than Stock Market Vidya, the trusted name for the best share market classes in Nagpur.
Get Started Today
Ready to sharpen your trading skills and understand trend lines like never before?
Stock Market Vidya, Nagpur
Contact: 9822718163 / 8421893845
Website: www.stockmarketvidya.com
✅ FAQs – Trend Lines in Technical Analysis
1. What is a trend line in stock market analysis?
A trend line is a straight line drawn on a price chart that connects two or more price points. It helps traders identify the overall direction of the market — whether it’s moving upward, downward, or sideways. Trend lines are key tools in technical analysis used to track price momentum and possible reversal points.
2. Why are trend lines important for traders?
Trend lines help traders visualize market trends, make informed entry and exit decisions, and identify support or resistance zones. They provide structure to market movement, making it easier to spot trading opportunities in any timeframe.
3. How can I draw an accurate trend line?
To draw an accurate trend line, you need to connect at least two significant swing lows in an uptrend or two swing highs in a downtrend. The more touches the line has, the more reliable it becomes. Always use candlestick wicks and avoid forcing a trend line to fit the price.
4. Do trend lines work for intraday trading?
Yes, trend lines are effective in intraday trading when applied to shorter timeframes like 5-minute or 15-minute charts. They help identify quick trend reversals, breakouts, and high-probability trade setups in a fast-moving market.
5. What happens when a trend line breaks?
When a price breaks below an uptrend line or above a downtrend line, it often signals a shift in market sentiment. This can indicate a possible trend reversal or the start of consolidation. Traders often wait for confirmation, such as a retest, before acting on the breakout.
6. Are trend lines enough for trading decisions?
While trend lines are powerful, they work best when combined with other tools like volume, RSI, MACD, or moving averages. This multi-tool approach improves decision-making and reduces the chances of false signals.
7. What’s the difference between a trend line and a channel?
A trend line connects price points in one direction (up or down), whereas a channel includes two parallel lines — one acting as support and the other as resistance — forming a price range within a trend.
8. Can beginners use trend lines effectively?
Absolutely. Trend lines are one of the easiest and most effective tools for beginners. With proper training, even newcomers can use them to understand price direction and build disciplined trading strategies.
9. Is trend line trading covered in Stock Market Vidya’s course?
Yes. At Stock Market Vidya, we offer practical, chart-based learning where trend lines and other technical tools are taught in-depth. Students learn how to draw, interpret, and trade using trend lines on real-time charts.
10. Where can I learn to trade using trend lines in Nagpur?
You can learn everything about trend lines, chart analysis, and trading strategies at Stock Market Vidya, one of the best share market classes in Nagpur. We offer in-person and guided sessions focused on practical stock market training.