Presented by Stock Market Vidya, Nagpur — Learn with India’s Finest Stock Market Training Institute
In the vast world of technical analysis, few theories carry the profound depth and predictive power of Elliott Wave Theory. Developed by Ralph Nelson Elliott in the 1930s, this concept is not just about patterns—it’s about understanding the psychological rhythm of the market. Whether you’re new to trading or looking to sharpen your edge, grasping the Elliott Wave Theory can offer you a powerful lens to anticipate market movements.
This blog by Stock Market Vidya, Nagpur’s leading institute run by Mr. Prashant Sarode, explores the Elliott Wave concept in an intuitive yet detailed manner. If you’re searching for the Best share market classes in Nagpur, this article will give you a taste of the expert-level insights taught in our stock market course and share market classes.
What Is Elliott Wave Theory?
At its core, Elliott Wave Theory suggests that markets move in repetitive cycles, primarily driven by crowd psychology. These cycles form recognizable patterns or “waves” on price charts.
Ralph Elliott noticed that the financial markets weren’t chaotic, as they often seemed—but rather followed a natural order based on the collective emotions of investors. These emotions cycle between optimism and pessimism, forming recurring wave patterns.
This theory is not just technical—it’s psychological. It teaches you to read between the lines of price action and understand the emotional forces driving the market.
The Foundation: Five Waves Up, Three Waves Down
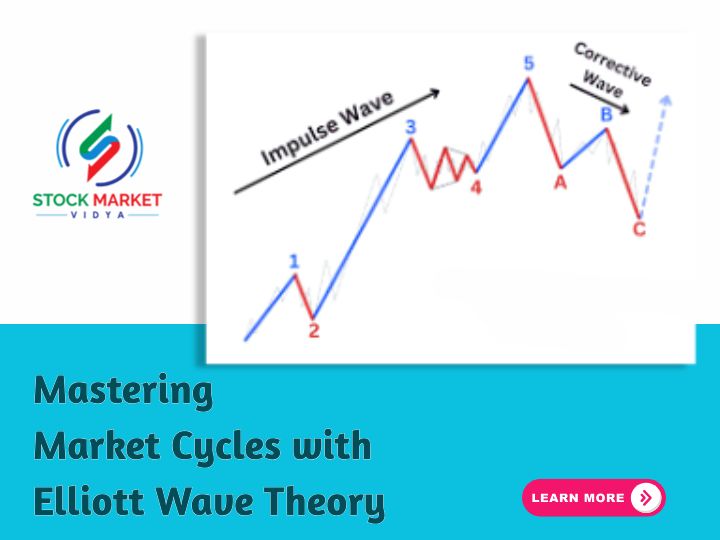
Elliott Waves are structured around a basic pattern: five waves in the direction of the main trend (called the impulse phase), followed by three corrective waves (called the corrective phase).
Here’s how it unfolds:
1. Impulse Wave (1-2-3-4-5)
- Wave 1: The market begins to rise—often unnoticed.
- Wave 2: A pullback occurs as early buyers take profits.
- Wave 3: This is the strongest, most explosive move—masses start entering.
- Wave 4: A pause or small correction.
- Wave 5: The final push before momentum wanes.
2. Corrective Wave (A-B-C)
- Wave A: Initial drop after Wave 5 peak.
- Wave B: Temporary recovery—some believe the uptrend continues.
- Wave C: A final decline, ending the correction.
This 5-3 structure then repeats itself, forming larger waves within even larger trends—a phenomenon called fractal nature.
Fractals in Elliott Waves: The Market’s DNA
One of the most brilliant aspects of Elliott Wave Theory is its fractal nature. Just like tree branches mimic the shape of the whole tree, small Elliott waves resemble larger ones.
Each wave itself consists of smaller sub-waves. That means:
- A Wave 1 can itself be made of five smaller waves.
- Wave A in a correction could consist of five downward waves.
This layered structure enables traders to analyze different timeframes with the same logic—whether you’re swing trading or investing long term.
Why Elliott Wave Theory Still Works in Today’s Markets
You might wonder—can a theory from the 1930s still hold relevance today? The answer is a strong yes.
Markets are still driven by human emotions—fear, greed, hope, panic, euphoria. The tools may have changed, algorithms may be faster, but the psychological cycles remain the same.
At Stock Market Vidya, our stock market training includes modern applications of Elliott Wave Theory combined with practical charting skills. The patterns repeat, but interpreting them in the context of modern volatility is where true mastery lies.
Identifying Elliott Waves on Charts: Not Always Easy, But Always Worth It
Spotting Elliott Waves in real time is part skill, part experience, and part art. Some waves are textbook clear, while others can be deceptive.
Here are some signs that help:
- Wave 3 is never the shortest among Waves 1, 3, and 5.
- Wave 2 never retraces more than 100% of Wave 1.
- Wave 4 usually doesn’t enter the territory of Wave 1.
These rules—called Elliott Wave guidelines—help keep your analysis disciplined and objective.
Elliott Wave and Trader Psychology
One reason why Elliott Wave Theory is so powerful is its ability to mirror investor sentiment.
Let’s map this to emotion:
- Wave 1: Disbelief — “Is this the start of a rally?”
- Wave 2: Caution — “I knew it wouldn’t last.”
- Wave 3: Excitement — “This is a bull market, let’s go all in!”
- Wave 4: Nervousness — “Should I take profits?”
- Wave 5: Euphoria — “It’ll never go down again!”
Understanding this psychological journey helps traders avoid emotional mistakes and act rationally when others react emotionally.
Applying Elliott Wave to Real Market Scenarios
Imagine you’re analyzing the Nifty 50 Index. The market has rallied from 15,000 to 19,000. Is it Wave 3? Or is Wave 5 ending?
Through Elliott Wave mapping, a trained eye can decipher whether to stay in the trade, reduce risk, or prepare for a correction.
In our share market course in Nagpur, students learn hands-on how to:
- Map out Elliott Waves across different timeframes.
- Combine Fibonacci retracements for accuracy.
- Use wave analysis to spot reversals before they happen.
Combining Elliott Wave with Technical Indicators
While Elliott Wave is powerful, it’s even more effective when paired with other tools like:
- Fibonacci retracement – to mark support/resistance zones.
- RSI or MACD – to confirm potential turning points in waves.
- Trend lines – to validate wave structure.
This multi-dimensional approach is part of our stock market training curriculum. We teach how to not just identify waves, but trade them with confidence and confluence.
Common Mistakes to Avoid in Elliott Wave Analysis
Elliott Wave Theory is as complex as it is beautiful. Beginners often:
- Mislabel waves due to emotion or bias.
- Force wave counts where none exist.
- Ignore the context of market news or fundamentals.
At Stock Market Vidya, we simplify wave recognition using a step-by-step learning method. Our share market training helps students avoid these pitfalls and build strong, logic-based trading decisions.
Why Learn Elliott Wave Theory with Stock Market Vidya
If you’re serious about developing trading skills that last a lifetime, learning Elliott Wave Theory is a must. But it’s not something you should try to master alone through free videos or scattered resources.
At Stock Market Vidya, we:
- Teach with real charts and live case studies.
- Provide focused, simplified lessons.
- Offer direct mentoring from Mr. Prashant Sarode, a seasoned market educator.
Whether you’re a beginner searching for a share market course near me, or an intermediate trader looking to level up, this is the place to start.
Final Thoughts: Let the Waves Guide You
Markets are not random. Beneath the chaos lies a natural, rhythmic pulse—and Elliott Wave Theory helps you hear that beat. It’s not about predicting the future with certainty, but preparing yourself for likely scenarios. It’s about understanding the language of price and emotion.
Join the Best share market classes in Nagpur at Stock Market Vidya and master advanced tools like Elliott Wave Theory through a practical and engaging approach.
Let the waves guide your trading journey—wisely, skillfully, and confidently.
Contact Stock Market Vidya – Nagpur’s Premier Share Market Institute
Call: 9822718163 / 8421893845
Visit: www.stockmarketvidya.com
Frequently Asked Questions (FAQs) About Elliott Wave Theory
Q1. What is Elliott Wave Theory in simple words?
Answer: Elliott Wave Theory is a method of analyzing market price movements using repeating wave patterns. It suggests that market prices move in cycles influenced by investor emotions—optimism and pessimism—forming five-wave trends and three-wave corrections. It helps traders forecast future price moves with improved clarity.
Q2. How many waves are there in Elliott Wave Theory?
Answer: The Elliott Wave Theory consists of eight waves in total—five waves in the direction of the trend (called impulse waves) and three waves in the opposite direction (called corrective waves). This 5-3 structure repeats across all timeframes due to its fractal nature.
Q3. Is Elliott Wave Theory reliable for trading?
Answer: Yes, when used correctly and with experience, Elliott Wave Theory can offer valuable insights into market trends and reversals. While it may require some interpretation, it becomes highly effective when combined with technical indicators like Fibonacci retracement, MACD, or RSI. At Stock Market Vidya, students are trained to use Elliott Waves with logic and clarity.
Q4. Can beginners learn Elliott Wave Theory easily?
Answer: While Elliott Wave Theory can appear complex at first, beginners can learn it step by step with proper guidance. A structured learning path, like the one offered at Stock Market Vidya, simplifies the concept using real-world chart examples and practical exercises.
Q5. Is Elliott Wave used only in stock trading?
Answer: No, Elliott Wave Theory can be applied across various markets, including stocks, forex, commodities, and cryptocurrencies. Any market that is influenced by crowd psychology and sentiment can be analyzed using wave patterns.
Q6. What is the most powerful wave in Elliott Theory?
Answer:Wave 3 is considered the most powerful and extended wave in the impulse structure. It typically shows strong price movement, high volume, and broad participation, as most traders recognize the trend during this wave.
Q7. How do I identify Elliott Waves on a chart?
Answer: Identifying Elliott Waves involves analyzing price action and structure:
- Count the waves according to the rules (5 uptrend, 3 correction).
- Look for patterns like zigzags, flats, and triangles.
- Use tools like Fibonacci levels and trendlines for support.
Learning this technique is part of the stock market training at Stock Market Vidya, Nagpur.
Q8. What are the common mistakes in applying Elliott Wave Theory?
Answer: Some common mistakes include:
- Mislabeling waves due to emotional bias.
- Forcing a wave count where none exists.
- Ignoring volume and timeframes.
Our expert-led share market classes teach students how to avoid these mistakes through live examples and personalized feedback.
Q9. Do professionals use Elliott Wave Theory?
Answer: Yes, many professional traders and analysts incorporate Elliott Wave Theory into their technical strategy toolkit. When used with discipline and in combination with other tools, it can become a core method for anticipating price moves and risk management.
Q10. Where can I learn Elliott Wave Theory with practical examples in Nagpur?
Answer: You can join Stock Market Vidya, one of the Best share market classes in Nagpur, founded by Mr. Prashant Sarode. Their share market course in Nagpur covers Elliott Wave Theory in detail, using real-time charts, case studies, and structured mentorship.
[{"id":791,"link":"https:\/\/stockmarketvidya.com\/blogs\/george-soros-master-of-risk-and-reward\/","name":"george-soros-master-of-risk-and-reward","thumbnail":{"url":"https:\/\/stockmarketvidya.com\/blogs\/wp-content\/uploads\/2026\/03\/George-Soros.jpg","alt":"George Soros: Master of Risk and Reward"},"title":"George Soros: Master of Risk and Reward","author":{"name":"Share Market Blog","link":"https:\/\/stockmarketvidya.com\/blogs\/author\/share-market-blog\/"},"date":"Mar 23, 2026","dateGMT":"2026-03-23 01:05:00","modifiedDate":"2026-03-21 09:06:11","modifiedDateGMT":"2026-03-21 09:06:11","commentCount":"0","commentStatus":"open","categories":{"coma":"<a href=\"https:\/\/stockmarketvidya.com\/blogs\/category\/share-market\/\" rel=\"category tag\">Share Market<\/a>","space":"<a href=\"https:\/\/stockmarketvidya.com\/blogs\/category\/share-market\/\" rel=\"category tag\">Share Market<\/a>"},"taxonomies":{"post_tag":"<a href='https:\/\/stockmarketvidya.com\/blogs\/tag\/black-wednesday-george-soros\/' rel='post_tag'>Black Wednesday George Soros<\/a><a href='https:\/\/stockmarketvidya.com\/blogs\/tag\/george-soros-investing-style\/' rel='post_tag'>George Soros investing style<\/a><a href='https:\/\/stockmarketvidya.com\/blogs\/tag\/george-soros-trading-strategy\/' rel='post_tag'>George Soros trading strategy<\/a><a href='https:\/\/stockmarketvidya.com\/blogs\/tag\/risk-management-in-trading\/' rel='post_tag'>risk management in trading<\/a><a href='https:\/\/stockmarketvidya.com\/blogs\/tag\/stock-market-legends\/' rel='post_tag'>stock market legends<\/a><a href='https:\/\/stockmarketvidya.com\/blogs\/tag\/trading-psychology-lessons\/' rel='post_tag'>trading psychology lessons<\/a>"},"readTime":{"min":8,"sec":34},"status":"publish","excerpt":""},{"id":786,"link":"https:\/\/stockmarketvidya.com\/blogs\/sectoral-investing-identifying-growth-opportunities-in-the-stock-market\/","name":"sectoral-investing-identifying-growth-opportunities-in-the-stock-market","thumbnail":{"url":"https:\/\/stockmarketvidya.com\/blogs\/wp-content\/uploads\/2026\/03\/Sectoral-Investing.jpg","alt":"Sectoral Investing: Identifying Growth Opportunities in the Stock Market"},"title":"Sectoral Investing: Identifying Growth Opportunities in the Stock Market","author":{"name":"Share Market Blog","link":"https:\/\/stockmarketvidya.com\/blogs\/author\/share-market-blog\/"},"date":"Mar 21, 2026","dateGMT":"2026-03-21 06:10:47","modifiedDate":"2026-03-21 06:10:49","modifiedDateGMT":"2026-03-21 06:10:49","commentCount":"0","commentStatus":"open","categories":{"coma":"<a href=\"https:\/\/stockmarketvidya.com\/blogs\/category\/share-market\/\" rel=\"category tag\">Share Market<\/a>","space":"<a href=\"https:\/\/stockmarketvidya.com\/blogs\/category\/share-market\/\" rel=\"category tag\">Share Market<\/a>"},"taxonomies":{"post_tag":"<a href='https:\/\/stockmarketvidya.com\/blogs\/tag\/how-to-identify-strong-sectors\/' rel='post_tag'>how to identify strong sectors<\/a><a href='https:\/\/stockmarketvidya.com\/blogs\/tag\/option-trading-course-nagpur\/' rel='post_tag'>option trading course Nagpur<\/a><a href='https:\/\/stockmarketvidya.com\/blogs\/tag\/sector-rotation-strategy\/' rel='post_tag'>sector rotation strategy<\/a><a href='https:\/\/stockmarketvidya.com\/blogs\/tag\/sectoral-investing\/' rel='post_tag'>sectoral investing<\/a><a href='https:\/\/stockmarketvidya.com\/blogs\/tag\/share-market-classes-nagpur\/' rel='post_tag'>share market classes Nagpur<\/a><a href='https:\/\/stockmarketvidya.com\/blogs\/tag\/stock-market-course-nagpur\/' rel='post_tag'>Stock Market Course Nagpur<\/a><a href='https:\/\/stockmarketvidya.com\/blogs\/tag\/stock-market-sectors-india\/' rel='post_tag'>stock market sectors India<\/a><a href='https:\/\/stockmarketvidya.com\/blogs\/tag\/stock-market-training-nagpur\/' rel='post_tag'>stock market training Nagpur<\/a><a href='https:\/\/stockmarketvidya.com\/blogs\/tag\/technical-analysis-course-nagpur\/' rel='post_tag'>technical analysis course Nagpur<\/a>"},"readTime":{"min":9,"sec":26},"status":"publish","excerpt":""},{"id":776,"link":"https:\/\/stockmarketvidya.com\/blogs\/can-share-market-knowledge-help-students-in-future-careers-yes-heres-how\/","name":"can-share-market-knowledge-help-students-in-future-careers-yes-heres-how","thumbnail":{"url":"https:\/\/stockmarketvidya.com\/blogs\/wp-content\/uploads\/2026\/03\/Can-Share-Market-Knowledge-Help-Students-in-Future-Careers.jpg","alt":"Can Share Market Knowledge Help Students in Future Careers? Yes\u2014Here\u2019s How"},"title":"Can Share Market Knowledge Help Students in Future Careers? Yes\u2014Here\u2019s How","author":{"name":"Share Market Blog","link":"https:\/\/stockmarketvidya.com\/blogs\/author\/share-market-blog\/"},"date":"Mar 20, 2026","dateGMT":"2026-03-20 05:51:04","modifiedDate":"2026-03-20 06:13:46","modifiedDateGMT":"2026-03-20 06:13:46","commentCount":"0","commentStatus":"open","categories":{"coma":"<a href=\"https:\/\/stockmarketvidya.com\/blogs\/category\/share-market\/\" rel=\"category tag\">Share Market<\/a>","space":"<a href=\"https:\/\/stockmarketvidya.com\/blogs\/category\/share-market\/\" rel=\"category tag\">Share Market<\/a>"},"taxonomies":{"post_tag":"<a href='https:\/\/stockmarketvidya.com\/blogs\/tag\/best-trading-institute-in-nagpur\/' rel='post_tag'>best trading institute in Nagpur<\/a><a href='https:\/\/stockmarketvidya.com\/blogs\/tag\/intraday-trading-course-nagpur\/' rel='post_tag'>intraday trading course Nagpur<\/a><a href='https:\/\/stockmarketvidya.com\/blogs\/tag\/option-trading-course-nagpur\/' rel='post_tag'>option trading course Nagpur<\/a><a href='https:\/\/stockmarketvidya.com\/blogs\/tag\/share-market-course-in-nagpur\/' rel='post_tag'>Share Market Course in Nagpur<\/a><a href='https:\/\/stockmarketvidya.com\/blogs\/tag\/stock-market-classes-for-beginners\/' rel='post_tag'>stock market classes for beginners<\/a><a href='https:\/\/stockmarketvidya.com\/blogs\/tag\/stock-market-course-for-students\/' rel='post_tag'>stock market course for students<\/a><a href='https:\/\/stockmarketvidya.com\/blogs\/tag\/stock-market-training-nagpur\/' rel='post_tag'>stock market training Nagpur<\/a><a href='https:\/\/stockmarketvidya.com\/blogs\/tag\/technical-analysis-course-nagpur\/' rel='post_tag'>technical analysis course Nagpur<\/a>"},"readTime":{"min":9,"sec":12},"status":"publish","excerpt":""},{"id":769,"link":"https:\/\/stockmarketvidya.com\/blogs\/developing-a-winning-trading-mindset-the-secret-behind-successful-traders-in-the-stock-market\/","name":"developing-a-winning-trading-mindset-the-secret-behind-successful-traders-in-the-stock-market","thumbnail":{"url":"https:\/\/stockmarketvidya.com\/blogs\/wp-content\/uploads\/2026\/03\/Developing-a-Winning-Trading-Mindset-1.png","alt":"Developing a Winning Trading Mindset: The Secret Behind Successful Traders in the Stock Market"},"title":"Developing a Winning Trading Mindset: The Secret Behind Successful Traders in the Stock Market","author":{"name":"Share Market Blog","link":"https:\/\/stockmarketvidya.com\/blogs\/author\/share-market-blog\/"},"date":"Mar 14, 2026","dateGMT":"2026-03-14 01:00:00","modifiedDate":"2026-03-21 07:03:43","modifiedDateGMT":"2026-03-21 07:03:43","commentCount":"0","commentStatus":"open","categories":{"coma":"<a href=\"https:\/\/stockmarketvidya.com\/blogs\/category\/share-market\/\" rel=\"category tag\">Share Market<\/a>, <a href=\"https:\/\/stockmarketvidya.com\/blogs\/category\/share-market-course\/\" rel=\"category tag\">Share Market Course<\/a>","space":"<a href=\"https:\/\/stockmarketvidya.com\/blogs\/category\/share-market\/\" rel=\"category tag\">Share Market<\/a> <a href=\"https:\/\/stockmarketvidya.com\/blogs\/category\/share-market-course\/\" rel=\"category tag\">Share Market Course<\/a>"},"taxonomies":{"post_tag":"<a href='https:\/\/stockmarketvidya.com\/blogs\/tag\/emotional-trading-control\/' rel='post_tag'>emotional trading control<\/a><a href='https:\/\/stockmarketvidya.com\/blogs\/tag\/intraday-trading-mindset\/' rel='post_tag'>intraday trading mindset<\/a><a href='https:\/\/stockmarketvidya.com\/blogs\/tag\/learn-trading-in-nagpur\/' rel='post_tag'>Learn Trading in Nagpur<\/a><a href='https:\/\/stockmarketvidya.com\/blogs\/tag\/share-market-course-nagpur\/' rel='post_tag'>share market course Nagpur<\/a><a href='https:\/\/stockmarketvidya.com\/blogs\/tag\/stock-market-classes-nagpur\/' rel='post_tag'>Stock market classes Nagpur<\/a><a href='https:\/\/stockmarketvidya.com\/blogs\/tag\/stock-market-psychology\/' rel='post_tag'>stock market psychology<\/a><a href='https:\/\/stockmarketvidya.com\/blogs\/tag\/technical-analysis-course-nagpur\/' rel='post_tag'>technical analysis course Nagpur<\/a>"},"readTime":{"min":15,"sec":42},"status":"publish","excerpt":""},{"id":766,"link":"https:\/\/stockmarketvidya.com\/blogs\/how-dividends-work-earn-passive-income-from-shares-in-the-indian-stock-market\/","name":"how-dividends-work-earn-passive-income-from-shares-in-the-indian-stock-market","thumbnail":{"url":"https:\/\/stockmarketvidya.com\/blogs\/wp-content\/uploads\/2026\/03\/How-Dividends-Work.jpg","alt":"How Dividends Work: Earn Passive Income from Shares in the Indian Stock Market"},"title":"How Dividends Work: Earn Passive Income from Shares in the Indian Stock Market","author":{"name":"Share Market Blog","link":"https:\/\/stockmarketvidya.com\/blogs\/author\/share-market-blog\/"},"date":"Mar 13, 2026","dateGMT":"2026-03-13 07:12:26","modifiedDate":"2026-03-13 07:12:28","modifiedDateGMT":"2026-03-13 07:12:28","commentCount":"0","commentStatus":"open","categories":{"coma":"<a href=\"https:\/\/stockmarketvidya.com\/blogs\/category\/share-market\/\" rel=\"category tag\">Share Market<\/a>, <a href=\"https:\/\/stockmarketvidya.com\/blogs\/category\/share-market-course\/\" rel=\"category tag\">Share Market Course<\/a>","space":"<a href=\"https:\/\/stockmarketvidya.com\/blogs\/category\/share-market\/\" rel=\"category tag\">Share Market<\/a> <a href=\"https:\/\/stockmarketvidya.com\/blogs\/category\/share-market-course\/\" rel=\"category tag\">Share Market Course<\/a>"},"taxonomies":{"post_tag":"<a href='https:\/\/stockmarketvidya.com\/blogs\/tag\/dividend-investing\/' rel='post_tag'>dividend investing<\/a><a href='https:\/\/stockmarketvidya.com\/blogs\/tag\/dividend-stocks-india\/' rel='post_tag'>dividend stocks India<\/a><a href='https:\/\/stockmarketvidya.com\/blogs\/tag\/financial-investing-india\/' rel='post_tag'>financial investing India<\/a><a href='https:\/\/stockmarketvidya.com\/blogs\/tag\/long-term-investing-2\/' rel='post_tag'>long term investing<\/a><a href='https:\/\/stockmarketvidya.com\/blogs\/tag\/passive-income-from-shares\/' rel='post_tag'>passive income from shares<\/a><a href='https:\/\/stockmarketvidya.com\/blogs\/tag\/portfolio-income-investing\/' rel='post_tag'>portfolio income investing<\/a><a href='https:\/\/stockmarketvidya.com\/blogs\/tag\/stock-market-beginners\/' rel='post_tag'>stock market beginners<\/a><a href='https:\/\/stockmarketvidya.com\/blogs\/tag\/stock-market-education\/' rel='post_tag'>Stock market education<\/a><a href='https:\/\/stockmarketvidya.com\/blogs\/tag\/wealth-creation-through-stocks\/' rel='post_tag'>wealth creation through stocks<\/a>"},"readTime":{"min":15,"sec":46},"status":"publish","excerpt":""},{"id":758,"link":"https:\/\/stockmarketvidya.com\/blogs\/small-cap-vs-mid-cap-vs-large-cap-stocks-where-should-smart-investors-in-nagpur-invest\/","name":"small-cap-vs-mid-cap-vs-large-cap-stocks-where-should-smart-investors-in-nagpur-invest","thumbnail":{"url":"https:\/\/stockmarketvidya.com\/blogs\/wp-content\/uploads\/2026\/03\/Small-Cap-vs-Mid-Cap-vs-Large-Cap-Stocks.jpg","alt":"Small Cap vs Mid Cap vs Large Cap Stocks: Where Should Smart Investors in Nagpur Invest?"},"title":"Small Cap vs Mid Cap vs Large Cap Stocks: Where Should Smart Investors in Nagpur Invest?","author":{"name":"Share Market Blog","link":"https:\/\/stockmarketvidya.com\/blogs\/author\/share-market-blog\/"},"date":"Mar 6, 2026","dateGMT":"2026-03-06 01:00:00","modifiedDate":"2026-03-04 11:33:11","modifiedDateGMT":"2026-03-04 11:33:11","commentCount":"0","commentStatus":"open","categories":{"coma":"<a href=\"https:\/\/stockmarketvidya.com\/blogs\/category\/share-market\/\" rel=\"category tag\">Share Market<\/a>, <a href=\"https:\/\/stockmarketvidya.com\/blogs\/category\/share-market-course\/\" rel=\"category tag\">Share Market Course<\/a>","space":"<a href=\"https:\/\/stockmarketvidya.com\/blogs\/category\/share-market\/\" rel=\"category tag\">Share Market<\/a> <a href=\"https:\/\/stockmarketvidya.com\/blogs\/category\/share-market-course\/\" rel=\"category tag\">Share Market Course<\/a>"},"taxonomies":{"post_tag":"<a href='https:\/\/stockmarketvidya.com\/blogs\/tag\/difference-between-small-mid-large-cap\/' rel='post_tag'>difference between small mid large cap<\/a><a href='https:\/\/stockmarketvidya.com\/blogs\/tag\/equity-investment-guide\/' rel='post_tag'>equity investment guide<\/a><a href='https:\/\/stockmarketvidya.com\/blogs\/tag\/investment-strategy-india-portfolio-diversification\/' rel='post_tag'>investment strategy India portfolio diversification<\/a><a href='https:\/\/stockmarketvidya.com\/blogs\/tag\/market-capitalization-explained\/' rel='post_tag'>market capitalization explained<\/a><a href='https:\/\/stockmarketvidya.com\/blogs\/tag\/market-cycles-investing\/' rel='post_tag'>market cycles investing<\/a><a href='https:\/\/stockmarketvidya.com\/blogs\/tag\/nifty-midcap-150\/' rel='post_tag'>NIFTY Midcap 150<\/a><a href='https:\/\/stockmarketvidya.com\/blogs\/tag\/nifty-smallcap-250\/' rel='post_tag'>NIFTY Smallcap 250<\/a><a href='https:\/\/stockmarketvidya.com\/blogs\/tag\/risk-management-in-stock-market-long-term-investing-india\/' rel='post_tag'>risk management in stock market long term investing India<\/a><a href='https:\/\/stockmarketvidya.com\/blogs\/tag\/sebi-stock-classification\/' rel='post_tag'>SEBI stock classification<\/a><a href='https:\/\/stockmarketvidya.com\/blogs\/tag\/share-market-classes-nagpur\/' rel='post_tag'>share market classes Nagpur<\/a><a href='https:\/\/stockmarketvidya.com\/blogs\/tag\/share-trading-classes-nagpur\/' rel='post_tag'>Share Trading Classes Nagpur<\/a><a href='https:\/\/stockmarketvidya.com\/blogs\/tag\/stock-market-course-nagpur\/' rel='post_tag'>Stock Market Course Nagpur<\/a><a href='https:\/\/stockmarketvidya.com\/blogs\/tag\/stock-market-training-nagpur\/' rel='post_tag'>stock market training Nagpur<\/a><a href='https:\/\/stockmarketvidya.com\/blogs\/tag\/stock-market-vidya\/' rel='post_tag'>Stock Market Vidya<\/a>"},"readTime":{"min":9,"sec":59},"status":"publish","excerpt":""},{"id":760,"link":"https:\/\/stockmarketvidya.com\/blogs\/stock-exchanges-explained-in-simple-words-nse-vs-bse-which-one-matters-for-you-as-a-trader\/","name":"stock-exchanges-explained-in-simple-words-nse-vs-bse-which-one-matters-for-you-as-a-trader","thumbnail":{"url":"https:\/\/stockmarketvidya.com\/blogs\/wp-content\/uploads\/2026\/03\/NSE-vs-BSE.jpg","alt":"Stock Exchanges Explained in Simple Words: NSE vs BSE \u2013 Which One Matters for You as a Trader?"},"title":"Stock Exchanges Explained in Simple Words: NSE vs BSE \u2013 Which One Matters for You as a Trader?","author":{"name":"Share Market Blog","link":"https:\/\/stockmarketvidya.com\/blogs\/author\/share-market-blog\/"},"date":"Mar 4, 2026","dateGMT":"2026-03-04 10:54:30","modifiedDate":"2026-03-04 10:54:31","modifiedDateGMT":"2026-03-04 10:54:31","commentCount":"0","commentStatus":"open","categories":{"coma":"<a href=\"https:\/\/stockmarketvidya.com\/blogs\/category\/share-market\/\" rel=\"category tag\">Share Market<\/a>, <a href=\"https:\/\/stockmarketvidya.com\/blogs\/category\/share-market-course\/\" rel=\"category tag\">Share Market Course<\/a>","space":"<a href=\"https:\/\/stockmarketvidya.com\/blogs\/category\/share-market\/\" rel=\"category tag\">Share Market<\/a> <a href=\"https:\/\/stockmarketvidya.com\/blogs\/category\/share-market-course\/\" rel=\"category tag\">Share Market Course<\/a>"},"taxonomies":{"post_tag":"<a href='https:\/\/stockmarketvidya.com\/blogs\/tag\/equity-market-india\/' rel='post_tag'>equity market India<\/a><a href='https:\/\/stockmarketvidya.com\/blogs\/tag\/futures-and-options-nse\/' rel='post_tag'>Futures and Options NSE<\/a><a href='https:\/\/stockmarketvidya.com\/blogs\/tag\/market-depth-analysis\/' rel='post_tag'>market depth analysis<\/a><a href='https:\/\/stockmarketvidya.com\/blogs\/tag\/order-matching-system\/' rel='post_tag'>order matching system<\/a><a href='https:\/\/stockmarketvidya.com\/blogs\/tag\/share-market-course-nagpur\/' rel='post_tag'>share market course Nagpur<\/a><a href='https:\/\/stockmarketvidya.com\/blogs\/tag\/share-trading-classes-nagpur\/' rel='post_tag'>Share Trading Classes Nagpur<\/a><a href='https:\/\/stockmarketvidya.com\/blogs\/tag\/stock-market-basics\/' rel='post_tag'>stock market basics<\/a><a href='https:\/\/stockmarketvidya.com\/blogs\/tag\/stock-market-for-beginners\/' rel='post_tag'>Stock market for beginners<\/a><a href='https:\/\/stockmarketvidya.com\/blogs\/tag\/stock-market-training-nagpur\/' rel='post_tag'>stock market training Nagpur<\/a><a href='https:\/\/stockmarketvidya.com\/blogs\/tag\/stock-market-vidya-nagpur\/' rel='post_tag'>Stock Market Vidya Nagpur<\/a><a href='https:\/\/stockmarketvidya.com\/blogs\/tag\/t1-settlement-cycle\/' rel='post_tag'>T+1 settlement cycle<\/a><a href='https:\/\/stockmarketvidya.com\/blogs\/tag\/trading-education-india\/' rel='post_tag'>trading education india<\/a>"},"readTime":{"min":11,"sec":24},"status":"publish","excerpt":""},{"id":744,"link":"https:\/\/stockmarketvidya.com\/blogs\/etf-is-the-smartest-investment-choice-today-a-practical-guide-for-modern-investors\/","name":"etf-is-the-smartest-investment-choice-today-a-practical-guide-for-modern-investors","thumbnail":{"url":"https:\/\/stockmarketvidya.com\/blogs\/wp-content\/uploads\/2026\/02\/ETF-Is-the-Smartest-Investment-Choice-Today-2.jpg","alt":""},"title":"ETF Is the Smartest Investment Choice Today \u2013 A Practical Guide for Modern Investors","author":{"name":"Share Market Blog","link":"https:\/\/stockmarketvidya.com\/blogs\/author\/share-market-blog\/"},"date":"Feb 26, 2026","dateGMT":"2026-02-26 12:29:32","modifiedDate":"2026-02-26 12:30:23","modifiedDateGMT":"2026-02-26 12:30:23","commentCount":"0","commentStatus":"open","categories":{"coma":"<a href=\"https:\/\/stockmarketvidya.com\/blogs\/category\/share-market\/\" rel=\"category tag\">Share Market<\/a>","space":"<a href=\"https:\/\/stockmarketvidya.com\/blogs\/category\/share-market\/\" rel=\"category tag\">Share Market<\/a>"},"taxonomies":{"post_tag":""},"readTime":{"min":10,"sec":51},"status":"publish","excerpt":""},{"id":739,"link":"https:\/\/stockmarketvidya.com\/blogs\/short-strangle-strategy-in-a-sideways-market\/","name":"short-strangle-strategy-in-a-sideways-market","thumbnail":{"url":"https:\/\/stockmarketvidya.com\/blogs\/wp-content\/uploads\/2026\/02\/Short-Strangle-Strategy-in-a-marketing-Experts.png","alt":"Short Strangle Strategy in a Sideways Market"},"title":"Short Strangle Strategy in a Sideways Market","author":{"name":"Share Market Blog","link":"https:\/\/stockmarketvidya.com\/blogs\/author\/share-market-blog\/"},"date":"Feb 22, 2026","dateGMT":"2026-02-22 01:00:00","modifiedDate":"2026-02-20 07:38:34","modifiedDateGMT":"2026-02-20 07:38:34","commentCount":"0","commentStatus":"open","categories":{"coma":"<a href=\"https:\/\/stockmarketvidya.com\/blogs\/category\/share-market\/\" rel=\"category tag\">Share Market<\/a>, <a href=\"https:\/\/stockmarketvidya.com\/blogs\/category\/share-market-course\/\" rel=\"category tag\">Share Market Course<\/a>","space":"<a href=\"https:\/\/stockmarketvidya.com\/blogs\/category\/share-market\/\" rel=\"category tag\">Share Market<\/a> <a href=\"https:\/\/stockmarketvidya.com\/blogs\/category\/share-market-course\/\" rel=\"category tag\">Share Market Course<\/a>"},"taxonomies":{"post_tag":""},"readTime":{"min":9,"sec":24},"status":"publish","excerpt":""},{"id":734,"link":"https:\/\/stockmarketvidya.com\/blogs\/buy-strangle-strategy-in-a-volatile-market-how-smart-traders-profit-from-big-price-moves\/","name":"buy-strangle-strategy-in-a-volatile-market-how-smart-traders-profit-from-big-price-moves","thumbnail":{"url":"https:\/\/stockmarketvidya.com\/blogs\/wp-content\/uploads\/2026\/02\/Buy-Strangle-Strategy-in-a-Volatile-Market.jpg","alt":"Buy Strangle Strategy in a Volatile Market: How Smart Traders Profit from Big Price Moves"},"title":"Buy Strangle Strategy in a Volatile Market: How Smart Traders Profit from Big Price Moves","author":{"name":"Share Market Blog","link":"https:\/\/stockmarketvidya.com\/blogs\/author\/share-market-blog\/"},"date":"Feb 20, 2026","dateGMT":"2026-02-20 06:36:50","modifiedDate":"2026-02-20 06:36:52","modifiedDateGMT":"2026-02-20 06:36:52","commentCount":"0","commentStatus":"open","categories":{"coma":"<a href=\"https:\/\/stockmarketvidya.com\/blogs\/category\/share-market\/\" rel=\"category tag\">Share Market<\/a>, <a href=\"https:\/\/stockmarketvidya.com\/blogs\/category\/share-market-course\/\" rel=\"category tag\">Share Market Course<\/a>","space":"<a href=\"https:\/\/stockmarketvidya.com\/blogs\/category\/share-market\/\" rel=\"category tag\">Share Market<\/a> <a href=\"https:\/\/stockmarketvidya.com\/blogs\/category\/share-market-course\/\" rel=\"category tag\">Share Market Course<\/a>"},"taxonomies":{"post_tag":""},"readTime":{"min":8,"sec":20},"status":"publish","excerpt":""},{"id":727,"link":"https:\/\/stockmarketvidya.com\/blogs\/short-straddle-in-sideways-market-a-complete-traders-perspective\/","name":"short-straddle-in-sideways-market-a-complete-traders-perspective","thumbnail":{"url":"https:\/\/stockmarketvidya.com\/blogs\/wp-content\/uploads\/2026\/02\/Short-Straddle-in-Sideways-Market.jpg","alt":"Short Straddle in Sideways Market: A Complete Trader\u2019s Perspective"},"title":"Short Straddle in Sideways Market: A Complete Trader\u2019s Perspective","author":{"name":"Share Market Blog","link":"https:\/\/stockmarketvidya.com\/blogs\/author\/share-market-blog\/"},"date":"Feb 13, 2026","dateGMT":"2026-02-13 01:55:00","modifiedDate":"2026-02-11 06:28:05","modifiedDateGMT":"2026-02-11 06:28:05","commentCount":"0","commentStatus":"open","categories":{"coma":"<a href=\"https:\/\/stockmarketvidya.com\/blogs\/category\/share-market\/\" rel=\"category tag\">Share Market<\/a>","space":"<a href=\"https:\/\/stockmarketvidya.com\/blogs\/category\/share-market\/\" rel=\"category tag\">Share Market<\/a>"},"taxonomies":{"post_tag":"<a href='https:\/\/stockmarketvidya.com\/blogs\/tag\/bank-nifty-option-selling-strategy\/' rel='post_tag'>BANK NIFTY option selling strategy<\/a><a href='https:\/\/stockmarketvidya.com\/blogs\/tag\/best-share-market-classes-in-nagpur\/' rel='post_tag'>Best share market classes in Nagpur<\/a><a href='https:\/\/stockmarketvidya.com\/blogs\/tag\/expiry-day-trading-strategy\/' rel='post_tag'>expiry day trading strategy<\/a><a href='https:\/\/stockmarketvidya.com\/blogs\/tag\/nifty-short-straddle\/' rel='post_tag'>NIFTY Short Straddle<\/a><a href='https:\/\/stockmarketvidya.com\/blogs\/tag\/nism-certified-trainer-nagpur\/' rel='post_tag'>NISM Certified Trainer Nagpur<\/a><a href='https:\/\/stockmarketvidya.com\/blogs\/tag\/non-directional-options-strategy\/' rel='post_tag'>Non Directional Options Strategy<\/a><a href='https:\/\/stockmarketvidya.com\/blogs\/tag\/option-selling-course-nagpur\/' rel='post_tag'>option selling course Nagpur<\/a><a href='https:\/\/stockmarketvidya.com\/blogs\/tag\/option-selling-strategy\/' rel='post_tag'>option selling strategy<\/a><a href='https:\/\/stockmarketvidya.com\/blogs\/tag\/options-trading-for-beginners\/' rel='post_tag'>Options trading for beginners<\/a><a href='https:\/\/stockmarketvidya.com\/blogs\/tag\/premium-decay-strategy\/' rel='post_tag'>premium decay strategy<\/a><a href='https:\/\/stockmarketvidya.com\/blogs\/tag\/professional-stock-market-training\/' rel='post_tag'>professional stock market training<\/a><a href='https:\/\/stockmarketvidya.com\/blogs\/tag\/range-bound-market-strategy\/' rel='post_tag'>range bound market strategy<\/a><a href='https:\/\/stockmarketvidya.com\/blogs\/tag\/share-market-classes-in-nagpur\/' rel='post_tag'>Share Market Classes in Nagpur<\/a><a href='https:\/\/stockmarketvidya.com\/blogs\/tag\/share-market-training-in-nagpur\/' rel='post_tag'>share market training in Nagpur<\/a><a href='https:\/\/stockmarketvidya.com\/blogs\/tag\/short-straddle-in-sideways-market\/' rel='post_tag'>Short Straddle in sideways market<\/a><a href='https:\/\/stockmarketvidya.com\/blogs\/tag\/short-straddle-strategy\/' rel='post_tag'>Short Straddle strategy<\/a><a href='https:\/\/stockmarketvidya.com\/blogs\/tag\/sideways-market-trading-strategy\/' rel='post_tag'>sideways market trading strategy<\/a><a href='https:\/\/stockmarketvidya.com\/blogs\/tag\/stock-market-course-near-me\/' rel='post_tag'>stock market course near me<\/a><a href='https:\/\/stockmarketvidya.com\/blogs\/tag\/stock-market-vidya-nagpur\/' rel='post_tag'>Stock Market Vidya Nagpur<\/a><a href='https:\/\/stockmarketvidya.com\/blogs\/tag\/time-decay-trading-strategy\/' rel='post_tag'>time decay trading strategy<\/a><a href='https:\/\/stockmarketvidya.com\/blogs\/tag\/volatility-based-option-selling\/' rel='post_tag'>volatility based option selling<\/a>"},"readTime":{"min":8,"sec":31},"status":"publish","excerpt":""},{"id":720,"link":"https:\/\/stockmarketvidya.com\/blogs\/buy-straddle-strategy-in-a-volatile-market-how-smart-traders-trade-big-moves-without-predicting-direction\/","name":"buy-straddle-strategy-in-a-volatile-market-how-smart-traders-trade-big-moves-without-predicting-direction","thumbnail":{"url":"https:\/\/stockmarketvidya.com\/blogs\/wp-content\/uploads\/2026\/02\/Buy-Straddle-Strategy-in-a-Volatile-Market.jpg","alt":"Buy Straddle Strategy in a Volatile Market: How Smart Traders Trade Big Moves Without Predicting Direction"},"title":"Buy Straddle Strategy in a Volatile Market: How Smart Traders Trade Big Moves Without Predicting Direction","author":{"name":"Share Market Blog","link":"https:\/\/stockmarketvidya.com\/blogs\/author\/share-market-blog\/"},"date":"Feb 11, 2026","dateGMT":"2026-02-11 05:52:31","modifiedDate":"2026-02-11 06:39:48","modifiedDateGMT":"2026-02-11 06:39:48","commentCount":"1","commentStatus":"open","categories":{"coma":"<a href=\"https:\/\/stockmarketvidya.com\/blogs\/category\/share-market\/\" rel=\"category tag\">Share Market<\/a>","space":"<a href=\"https:\/\/stockmarketvidya.com\/blogs\/category\/share-market\/\" rel=\"category tag\">Share Market<\/a>"},"taxonomies":{"post_tag":"<a href='https:\/\/stockmarketvidya.com\/blogs\/tag\/banknifty-straddle-strategy\/' rel='post_tag'>BANKNIFTY straddle strategy<\/a><a href='https:\/\/stockmarketvidya.com\/blogs\/tag\/best-share-market-classes-in-nagpur\/' rel='post_tag'>Best share market classes in Nagpur<\/a><a href='https:\/\/stockmarketvidya.com\/blogs\/tag\/buy-straddle-in-volatile-market\/' rel='post_tag'>Buy Straddle in volatile market<\/a><a href='https:\/\/stockmarketvidya.com\/blogs\/tag\/buy-straddle-strategy\/' rel='post_tag'>Buy Straddle strategy<\/a><a href='https:\/\/stockmarketvidya.com\/blogs\/tag\/direction-neutral-trading-strategy\/' rel='post_tag'>direction neutral trading strategy<\/a><a href='https:\/\/stockmarketvidya.com\/blogs\/tag\/event-based-trading\/' rel='post_tag'>event based trading<\/a><a href='https:\/\/stockmarketvidya.com\/blogs\/tag\/how-to-trade-straddle\/' rel='post_tag'>how to trade straddle<\/a><a href='https:\/\/stockmarketvidya.com\/blogs\/tag\/intraday-options-strategy\/' rel='post_tag'>intraday options strategy<\/a><a href='https:\/\/stockmarketvidya.com\/blogs\/tag\/nifty-options-strategy\/' rel='post_tag'>Nifty Options Strategy<\/a><a href='https:\/\/stockmarketvidya.com\/blogs\/tag\/nism-certified-trainer-nagpur\/' rel='post_tag'>NISM Certified Trainer Nagpur<\/a><a href='https:\/\/stockmarketvidya.com\/blogs\/tag\/options-trading-course-nagpur\/' rel='post_tag'>options trading course Nagpur<\/a><a href='https:\/\/stockmarketvidya.com\/blogs\/tag\/options-trading-for-beginners\/' rel='post_tag'>Options trading for beginners<\/a><a href='https:\/\/stockmarketvidya.com\/blogs\/tag\/options-trading-strategy\/' rel='post_tag'>Options trading strategy<\/a><a href='https:\/\/stockmarketvidya.com\/blogs\/tag\/risk-management-in-options-trading\/' rel='post_tag'>risk management in options trading<\/a><a href='https:\/\/stockmarketvidya.com\/blogs\/tag\/share-market-classes-in-nagpur\/' rel='post_tag'>Share Market Classes in Nagpur<\/a><a href='https:\/\/stockmarketvidya.com\/blogs\/tag\/share-market-training-in-nagpur\/' rel='post_tag'>share market training in Nagpur<\/a><a href='https:\/\/stockmarketvidya.com\/blogs\/tag\/stock-market-course-near-me\/' rel='post_tag'>stock market course near me<\/a><a href='https:\/\/stockmarketvidya.com\/blogs\/tag\/stock-market-vidya-nagpur\/' rel='post_tag'>Stock Market Vidya Nagpur<\/a><a href='https:\/\/stockmarketvidya.com\/blogs\/tag\/volatility-based-trading\/' rel='post_tag'>volatility based trading<\/a><a href='https:\/\/stockmarketvidya.com\/blogs\/tag\/volatility-trading-strategy\/' rel='post_tag'>volatility trading strategy<\/a>"},"readTime":{"min":8,"sec":47},"status":"publish","excerpt":""}]