By Stock Market Vidya, Nagpur | Mr. Prashant Sarode
Are you trying to predict the next big move in the stock market? Wondering what candles on a chart are trying to tell you?
Welcome to the secret code of trading – Candlestick Patterns .
If you’re serious about learning to trade, mastering candlestick patterns is not optional – it’s essential. These tiny shapes and wicks on your trading chart hold the power to tell you the market’s story – whether it’s fear, greed, reversal, or momentum. And this blog is your visual guide to understanding them—step-by-step, with hand-drawn-style diagrams and real-world trading insights.
Whether you’re just beginning your journey through a stock market course share market training Stock Market Vidya , the best share market classes in Nagpur , is designed to make candlesticks your new best friend.
Let’s light the candle and start decoding!
Why Learn Candlestick Patterns? Candlestick patterns are not just historical data—they are reflections of market psychology. Every pattern reveals what buyers and sellers are doing and how momentum is shifting.
Candlesticks help you:
Identify potential entry and exit points
Read market mood in real-time
Build conviction before taking trades
Stay ahead of trends, reversals, and breakouts
If you’re enrolled in a share market course in Nagpur , this is the visual tool you must master.
Anatomy of a Candlestick (Before We Jump into Patterns) Before we dive into patterns, let’s quickly understand how to read a single candlestick.
Imagine a candle with a body and two wicks (shadows) sticking out from the top and bottom. That candle tells you four things for a given time period:
Open : Price at which the market openedHigh : Highest price during the sessionLow : Lowest priceClose : Final price of the session
If the close is higher than the open, it’s typically a green or white candle (bullish). If the close is lower, it’s a red or black candle (bearish).
Category 1: Single Candlestick Patterns – Simplicity with Power
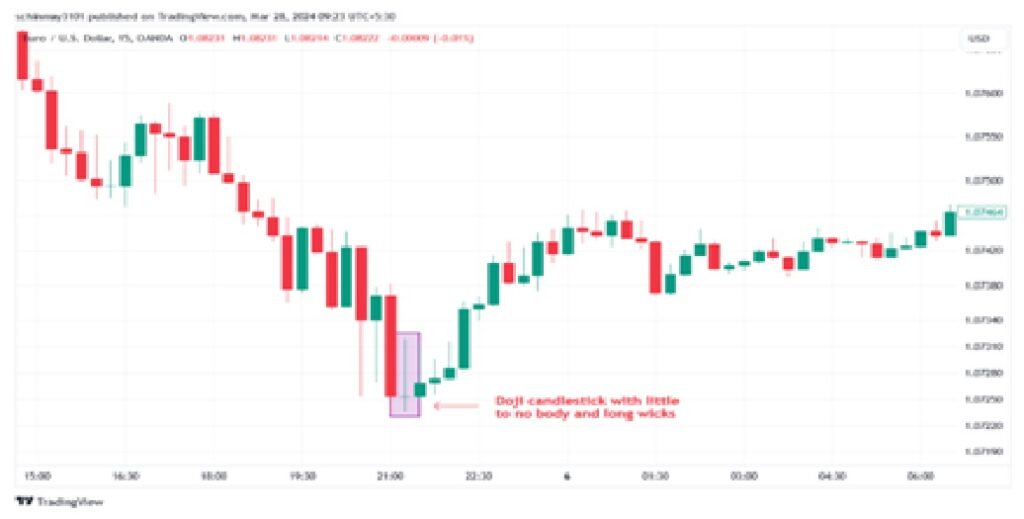
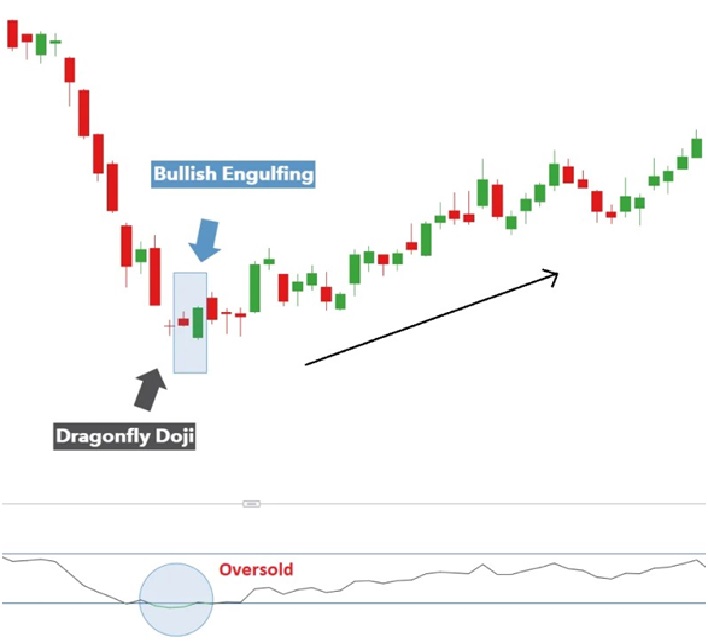
1. Doji – Market Confusion at its Peak The Doji has almost no body – the open and close are nearly the same. It signals indecision and often precedes reversals.
When it appears at market tops or bottoms , traders prepare for trend changes.
Green – Bullish Reversal Doji at support
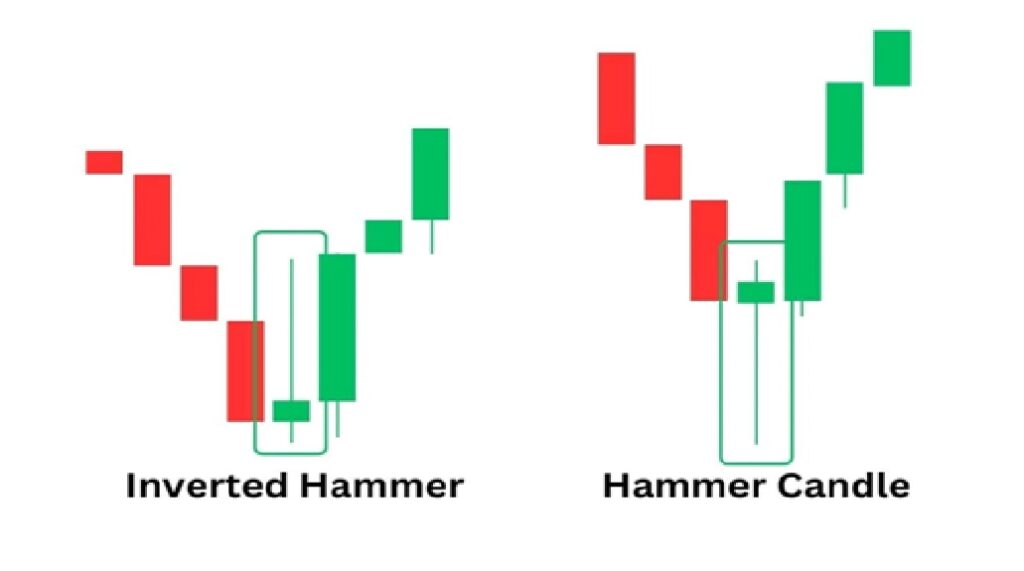
2. Hammer – Buyers Taking Control A hammer has a small body at the top with a long lower shadow.
It appears after a downtrend and suggests that buyers rejected lower prices and pulled it back up.
3. Inverted Hammer – Cautious Optimism This is like the hammer flipped upside-down. It also appears after a downtrend.
Its long upper wick shows that buyers tried to push prices up but faced resistance. Still, it’s often seen before a reversal.
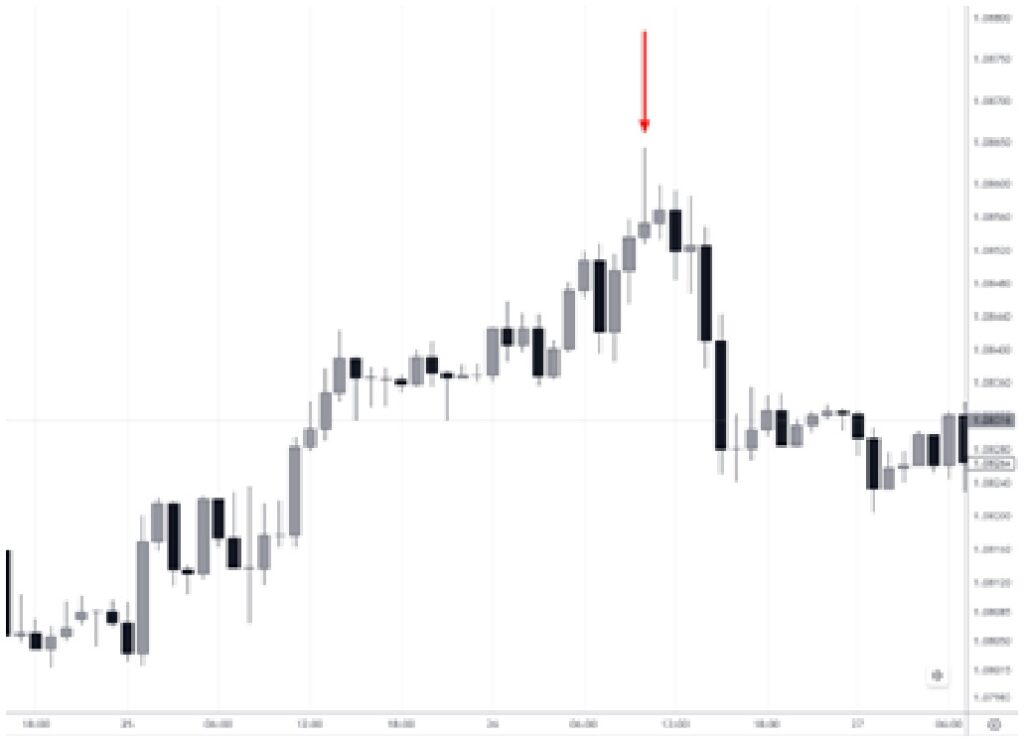
4. Shooting Star – Warning of Fall Looks like an inverted hammer but appears at the top of an uptrend.
It signals buyer exhaustion and possible trend reversal.
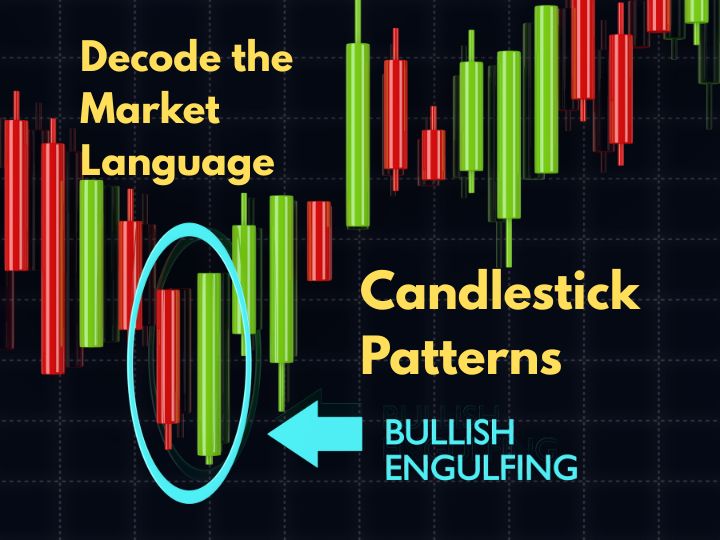
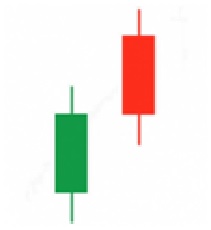
Category 2: Double Candlestick Patterns – When Two Candles Talk 1. Bullish Engulfing – Trend is Changing In this pattern, a small red candle is followed by a large green candle that completely engulfs the red one.
It indicates strong buying pressure.
Best used near support zones.
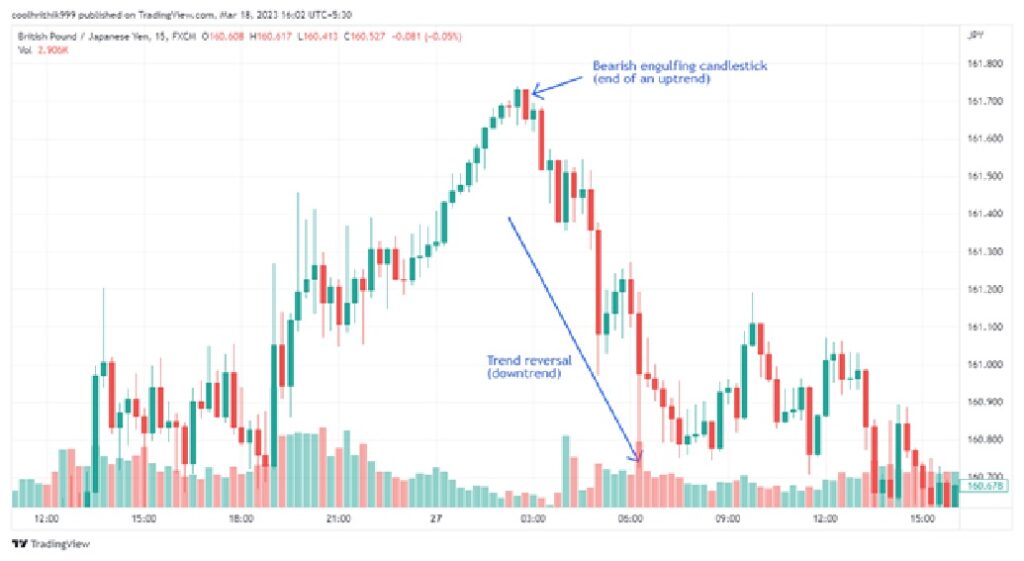
2. Bearish Engulfing – Trend May Fall Exactly opposite. A small green candle is followed by a big red candle that eats it up. If seen near resistance, this is often a warning to exit long positions.
3. Piercing Line – Buyers Fight Back First candle is red, second is green and opens lower but closes more than halfway into the red candle.
This shows buyers are ready to take control.
4. Dark Cloud Cover – Watch Your Longs First candle is green, second is red. The red candle opens higher but closes below the midpoint of the green candle.
It hints at a bearish reversal.
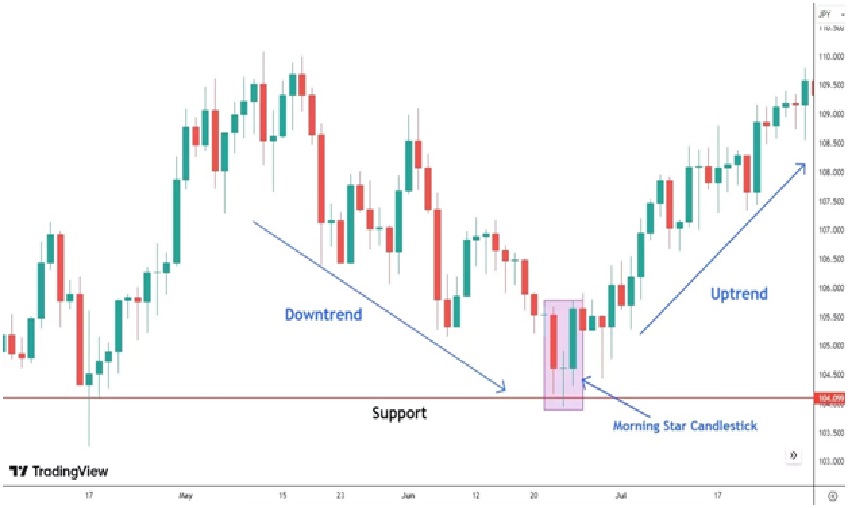
Category 3: Triple Candlestick Patterns – Powerful Price Confirmations 1. Morning Star – The Light After Darkness Three candles form this pattern:
Long red (bearish)
Small-bodied candle (could be red or green)
Strong green candle
Appears at the bottom of a downtrend. It’s a solid bullish reversal signal.
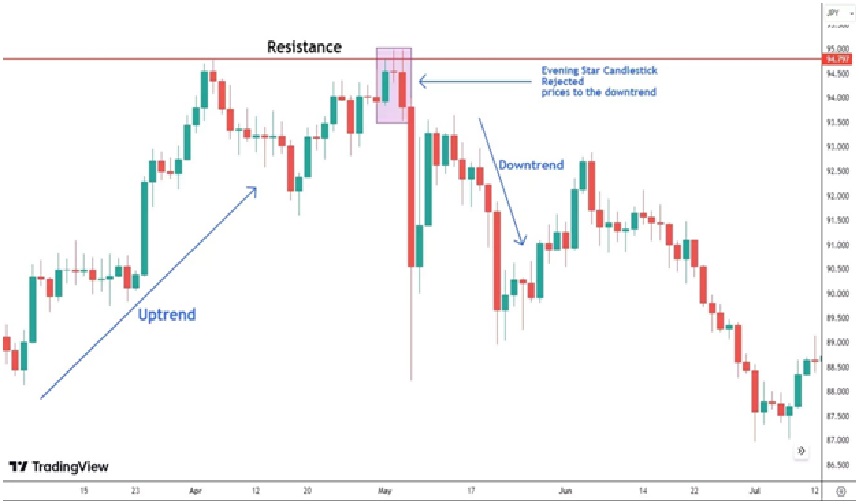
2. Evening Star – Sunset for Bulls Same as Morning Star, but in reverse:
Long green candle
Small candle
Strong red candle
Appears after an uptrend, indicating reversal.
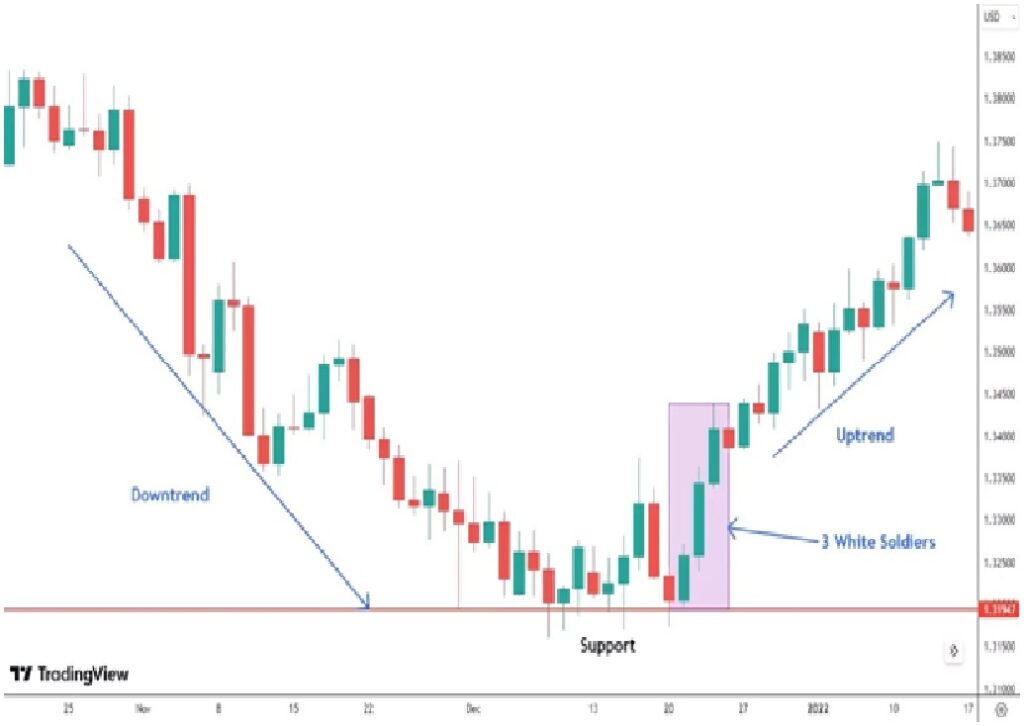
3. Three White Soldiers – Bull Power Parade Three consecutive green candles with higher highs and higher closes.
Indicates a strong bullish momentum, often continuing for days.
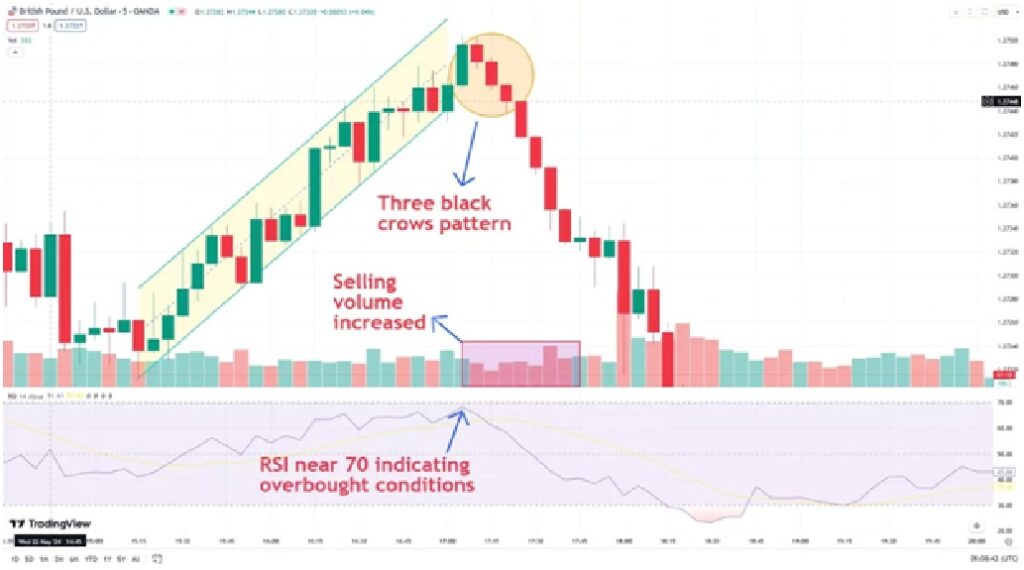
4. Three Black Crows – Bear Army Incoming Three back-to-back red candles with lower lows and closes.
Indicates aggressive selling and potential downtrend.
How to Use These Patterns in Real Trading? Candlestick patterns are not stand-alone signals . Combine them with:
Support/resistance zones
Moving averages
RSI, MACD
Volume confirmation
In the stock market course at Stock Market Vidya, we teach how to mix patterns with technical analysis and price action for high-probability trades.
Case Study: How a Student Spotted a Winning Trade with Just Candles Ravi, a student from our share market course in Nagpur , spotted a Bullish Engulfing pattern on a PSU stock right at support.
Combined with RSI divergence and increasing volume, he entered the trade early. Within 5 sessions, the stock gave a 12% move.
Candlestick + Logic = Profit Potential
Tips to Master Candlestick Patterns
Don’t memorize—understand the psychology
Practice spotting patterns on historical charts
Use patterns with confirmation tools like RSI or volume
Avoid over-trading just because you see a pattern
Combine candles with share market training for maximum clarity
Why Learn This with Stock Market Vidya? At Stock Market Vidya, we don’t just teach theory. We help you see the story behind each candle . Whether you’re searching for share market course near me or aspiring to become a full-time trader, our stock market training blends practical learning with real-world insights.
Under the expert guidance of Mr. Prashant Sarode , our institute offers:
Hands-on technical charting sessions
Pattern recognition practice on live markets
Personalized guidance for learning pace
Call us today to know more:www.stockmarketvidya.com
Final Thought – Candlesticks Are the Market’s Voice. Are You Listening? Markets speak every moment. Through price, through volume, and especially through candles.
You don’t need hundreds of indicators. Just a few powerful candlestick patterns and some chart time can make all the difference in your trading journey.
If you’re ready to take your skills seriously and searching for the best share market classes in Nagpur , let candlestick mastery be your first step. Because charts never lie – and candles always whisper the truth.
Light the wick, follow the pattern, and let the profits follow.
Frequently Asked Questions (FAQs) 1. What are candlestick patterns in the stock market? Candlestick patterns are visual formations created by the price movements of stocks on a chart. Each candlestick shows the open, high, low, and close prices for a specific time frame. Patterns formed by one or more candlesticks can signal potential future price movements, helping traders make informed decisions.
2. Are candlestick patterns accurate for predicting market direction? Candlestick patterns are one of the most widely used tools in technical analysis. While no method is 100% accurate, when combined with support/resistance, volume, and momentum indicators, candlestick patterns provide high-probability trade setups . At Stock Market Vidya , we train students to use patterns effectively along with other trading tools.
3. Can beginners learn candlestick patterns easily? Yes, beginners can start learning candlestick patterns easily. Many patterns are visually intuitive and based on simple logic. With practice and guidance, even someone new to trading can spot reliable candlestick signals. Our share market classes
4. Which are the most powerful candlestick patterns? Some of the most powerful and frequently used candlestick patterns include:
Hammer Bullish Engulfing Morning Star Doji Shooting Star Three White Soldiers
These patterns are covered in detail with diagrams in our stock market course at Stock Market Vidya.
5. How many candlestick patterns are there in total? There are dozens of candlestick patterns, including single, double, and triple candle formations. However, traders often focus on 10 to 15 key patterns that appear frequently and offer strong signals. Our share market training program focuses on the most practical and effective ones for trading in Indian markets.
6. Can candlestick patterns be used for intraday trading? Absolutely. Candlestick patterns are very popular among intraday traders because they appear quickly and can be used on smaller time frames like 5-minute, 15-minute, or hourly charts. During our stock market training , we demonstrate real-time strategies using candlestick signals.
7. How long does it take to master candlestick patterns? While basic understanding can be achieved in a few sessions, mastery takes regular practice . With the right guidance and live chart practice, most learners start using candlestick patterns effectively within a few weeks. Our structured approach at Stock Market Vidya Nagpur helps learners progress quickly with confidence.
8. Do you teach candlestick patterns in your share market course? Yes. At Stock Market Vidya , candlestick patterns are a core part of our share market course in Nagpur
9. Is learning candlestick patterns enough to become a successful trader? Candlestick patterns are a great start, but successful trading also involves:
Understanding risk management
Reading market structure
Using volume and indicators
Emotional discipline
At Stock Market Vidya , we provide complete stock market training to cover all aspects of trading, not just patterns.
10. Where can I learn candlestick trading in Nagpur? You can learn professional candlestick trading at Stock Market Vidya , the best share market classes in Nagpur , led by expert trainer Mr. Prashant Sarode . Whether you’re a beginner or someone looking to upgrade your skills, our share market training program is tailored for all levels.
11. Do candlestick patterns work in all types of markets? Yes. Candlestick patterns are applicable in various markets such as:
Equity (stocks)
Futures
Options
Commodities
Forex
Cryptocurrencies
They are universal because they are based on price action, not asset type.
12. Do you provide hands-on practice on live charts? Yes, at Stock Market Vidya , we focus on practical learning. You’ll get hands-on training on live market charts , so you can spot and apply candlestick patterns in real time, not just in theory.
13. What tools or platforms are needed to practice candlestick patterns? You can use free charting platforms like TradingView , Chartink , or BSE/NSE terminals . In our stock market course , we guide students on how to set up their charts, choose the right time frames, and identify patterns using these tools efficiently.
14. What makes Stock Market Vidya the best place to learn candlestick trading?
Clear, step-by-step teaching style
Practical sessions using Indian stocks
Personalized chart analysis practice
Focus on market psychology behind each pattern
Experienced mentorship by Mr. Prashant Sarode
That’s why we’re recognized as the best share market classes in Nagpur .
15. How can I enroll in the candlestick training module at Stock Market Vidya? You can reach out directly to us:
Call/WhatsApp : 9822718163, 8421893845Visit : www.stockmarketvidya.com Batch Timing : Flexible weekday & weekend sessions available
Just mention you’re interested in candlestick pattern training, and our team will guide you with all details.
[{"id":791,"link":"https:\/\/stockmarketvidya.com\/blogs\/george-soros-master-of-risk-and-reward\/","name":"george-soros-master-of-risk-and-reward","thumbnail":{"url":"https:\/\/stockmarketvidya.com\/blogs\/wp-content\/uploads\/2026\/03\/George-Soros.jpg","alt":"George Soros: Master of Risk and Reward"},"title":"George Soros: Master of Risk and Reward","author":{"name":"Share Market Blog","link":"https:\/\/stockmarketvidya.com\/blogs\/author\/share-market-blog\/"},"date":"Mar 23, 2026","dateGMT":"2026-03-23 01:05:00","modifiedDate":"2026-03-21 09:06:11","modifiedDateGMT":"2026-03-21 09:06:11","commentCount":"0","commentStatus":"open","categories":{"coma":"<a href=\"https:\/\/stockmarketvidya.com\/blogs\/category\/share-market\/\" rel=\"category tag\">Share Market<\/a>","space":"<a href=\"https:\/\/stockmarketvidya.com\/blogs\/category\/share-market\/\" rel=\"category tag\">Share Market<\/a>"},"taxonomies":{"post_tag":"<a href='https:\/\/stockmarketvidya.com\/blogs\/tag\/black-wednesday-george-soros\/' rel='post_tag'>Black Wednesday George Soros<\/a><a href='https:\/\/stockmarketvidya.com\/blogs\/tag\/george-soros-investing-style\/' rel='post_tag'>George Soros investing style<\/a><a href='https:\/\/stockmarketvidya.com\/blogs\/tag\/george-soros-trading-strategy\/' rel='post_tag'>George Soros trading strategy<\/a><a href='https:\/\/stockmarketvidya.com\/blogs\/tag\/risk-management-in-trading\/' rel='post_tag'>risk management in trading<\/a><a href='https:\/\/stockmarketvidya.com\/blogs\/tag\/stock-market-legends\/' rel='post_tag'>stock market legends<\/a><a href='https:\/\/stockmarketvidya.com\/blogs\/tag\/trading-psychology-lessons\/' rel='post_tag'>trading psychology lessons<\/a>"},"readTime":{"min":8,"sec":34},"status":"publish","excerpt":""},{"id":786,"link":"https:\/\/stockmarketvidya.com\/blogs\/sectoral-investing-identifying-growth-opportunities-in-the-stock-market\/","name":"sectoral-investing-identifying-growth-opportunities-in-the-stock-market","thumbnail":{"url":"https:\/\/stockmarketvidya.com\/blogs\/wp-content\/uploads\/2026\/03\/Sectoral-Investing.jpg","alt":"Sectoral Investing: Identifying Growth Opportunities in the Stock Market"},"title":"Sectoral Investing: Identifying Growth Opportunities in the Stock Market","author":{"name":"Share Market Blog","link":"https:\/\/stockmarketvidya.com\/blogs\/author\/share-market-blog\/"},"date":"Mar 21, 2026","dateGMT":"2026-03-21 06:10:47","modifiedDate":"2026-03-21 06:10:49","modifiedDateGMT":"2026-03-21 06:10:49","commentCount":"0","commentStatus":"open","categories":{"coma":"<a href=\"https:\/\/stockmarketvidya.com\/blogs\/category\/share-market\/\" rel=\"category tag\">Share Market<\/a>","space":"<a href=\"https:\/\/stockmarketvidya.com\/blogs\/category\/share-market\/\" rel=\"category tag\">Share Market<\/a>"},"taxonomies":{"post_tag":"<a href='https:\/\/stockmarketvidya.com\/blogs\/tag\/how-to-identify-strong-sectors\/' rel='post_tag'>how to identify strong sectors<\/a><a href='https:\/\/stockmarketvidya.com\/blogs\/tag\/option-trading-course-nagpur\/' rel='post_tag'>option trading course Nagpur<\/a><a href='https:\/\/stockmarketvidya.com\/blogs\/tag\/sector-rotation-strategy\/' rel='post_tag'>sector rotation strategy<\/a><a href='https:\/\/stockmarketvidya.com\/blogs\/tag\/sectoral-investing\/' rel='post_tag'>sectoral investing<\/a><a href='https:\/\/stockmarketvidya.com\/blogs\/tag\/share-market-classes-nagpur\/' rel='post_tag'>share market classes Nagpur<\/a><a href='https:\/\/stockmarketvidya.com\/blogs\/tag\/stock-market-course-nagpur\/' rel='post_tag'>Stock Market Course Nagpur<\/a><a href='https:\/\/stockmarketvidya.com\/blogs\/tag\/stock-market-sectors-india\/' rel='post_tag'>stock market sectors India<\/a><a href='https:\/\/stockmarketvidya.com\/blogs\/tag\/stock-market-training-nagpur\/' rel='post_tag'>stock market training Nagpur<\/a><a href='https:\/\/stockmarketvidya.com\/blogs\/tag\/technical-analysis-course-nagpur\/' rel='post_tag'>technical analysis course Nagpur<\/a>"},"readTime":{"min":9,"sec":26},"status":"publish","excerpt":""},{"id":776,"link":"https:\/\/stockmarketvidya.com\/blogs\/can-share-market-knowledge-help-students-in-future-careers-yes-heres-how\/","name":"can-share-market-knowledge-help-students-in-future-careers-yes-heres-how","thumbnail":{"url":"https:\/\/stockmarketvidya.com\/blogs\/wp-content\/uploads\/2026\/03\/Can-Share-Market-Knowledge-Help-Students-in-Future-Careers.jpg","alt":"Can Share Market Knowledge Help Students in Future Careers? Yes\u2014Here\u2019s How"},"title":"Can Share Market Knowledge Help Students in Future Careers? Yes\u2014Here\u2019s How","author":{"name":"Share Market Blog","link":"https:\/\/stockmarketvidya.com\/blogs\/author\/share-market-blog\/"},"date":"Mar 20, 2026","dateGMT":"2026-03-20 05:51:04","modifiedDate":"2026-03-20 06:13:46","modifiedDateGMT":"2026-03-20 06:13:46","commentCount":"0","commentStatus":"open","categories":{"coma":"<a href=\"https:\/\/stockmarketvidya.com\/blogs\/category\/share-market\/\" rel=\"category tag\">Share Market<\/a>","space":"<a href=\"https:\/\/stockmarketvidya.com\/blogs\/category\/share-market\/\" rel=\"category tag\">Share Market<\/a>"},"taxonomies":{"post_tag":"<a href='https:\/\/stockmarketvidya.com\/blogs\/tag\/best-trading-institute-in-nagpur\/' rel='post_tag'>best trading institute in Nagpur<\/a><a href='https:\/\/stockmarketvidya.com\/blogs\/tag\/intraday-trading-course-nagpur\/' rel='post_tag'>intraday trading course Nagpur<\/a><a href='https:\/\/stockmarketvidya.com\/blogs\/tag\/option-trading-course-nagpur\/' rel='post_tag'>option trading course Nagpur<\/a><a href='https:\/\/stockmarketvidya.com\/blogs\/tag\/share-market-course-in-nagpur\/' rel='post_tag'>Share Market Course in Nagpur<\/a><a href='https:\/\/stockmarketvidya.com\/blogs\/tag\/stock-market-classes-for-beginners\/' rel='post_tag'>stock market classes for beginners<\/a><a href='https:\/\/stockmarketvidya.com\/blogs\/tag\/stock-market-course-for-students\/' rel='post_tag'>stock market course for students<\/a><a href='https:\/\/stockmarketvidya.com\/blogs\/tag\/stock-market-training-nagpur\/' rel='post_tag'>stock market training Nagpur<\/a><a href='https:\/\/stockmarketvidya.com\/blogs\/tag\/technical-analysis-course-nagpur\/' rel='post_tag'>technical analysis course Nagpur<\/a>"},"readTime":{"min":9,"sec":12},"status":"publish","excerpt":""},{"id":769,"link":"https:\/\/stockmarketvidya.com\/blogs\/developing-a-winning-trading-mindset-the-secret-behind-successful-traders-in-the-stock-market\/","name":"developing-a-winning-trading-mindset-the-secret-behind-successful-traders-in-the-stock-market","thumbnail":{"url":"https:\/\/stockmarketvidya.com\/blogs\/wp-content\/uploads\/2026\/03\/Developing-a-Winning-Trading-Mindset-1.png","alt":"Developing a Winning Trading Mindset: The Secret Behind Successful Traders in the Stock Market"},"title":"Developing a Winning Trading Mindset: The Secret Behind Successful Traders in the Stock Market","author":{"name":"Share Market Blog","link":"https:\/\/stockmarketvidya.com\/blogs\/author\/share-market-blog\/"},"date":"Mar 14, 2026","dateGMT":"2026-03-14 01:00:00","modifiedDate":"2026-03-21 07:03:43","modifiedDateGMT":"2026-03-21 07:03:43","commentCount":"0","commentStatus":"open","categories":{"coma":"<a href=\"https:\/\/stockmarketvidya.com\/blogs\/category\/share-market\/\" rel=\"category tag\">Share Market<\/a>, <a href=\"https:\/\/stockmarketvidya.com\/blogs\/category\/share-market-course\/\" rel=\"category tag\">Share Market Course<\/a>","space":"<a href=\"https:\/\/stockmarketvidya.com\/blogs\/category\/share-market\/\" rel=\"category tag\">Share Market<\/a> <a href=\"https:\/\/stockmarketvidya.com\/blogs\/category\/share-market-course\/\" rel=\"category tag\">Share Market Course<\/a>"},"taxonomies":{"post_tag":"<a href='https:\/\/stockmarketvidya.com\/blogs\/tag\/emotional-trading-control\/' rel='post_tag'>emotional trading control<\/a><a href='https:\/\/stockmarketvidya.com\/blogs\/tag\/intraday-trading-mindset\/' rel='post_tag'>intraday trading mindset<\/a><a href='https:\/\/stockmarketvidya.com\/blogs\/tag\/learn-trading-in-nagpur\/' rel='post_tag'>Learn Trading in Nagpur<\/a><a href='https:\/\/stockmarketvidya.com\/blogs\/tag\/share-market-course-nagpur\/' rel='post_tag'>share market course Nagpur<\/a><a href='https:\/\/stockmarketvidya.com\/blogs\/tag\/stock-market-classes-nagpur\/' rel='post_tag'>Stock market classes Nagpur<\/a><a href='https:\/\/stockmarketvidya.com\/blogs\/tag\/stock-market-psychology\/' rel='post_tag'>stock market psychology<\/a><a href='https:\/\/stockmarketvidya.com\/blogs\/tag\/technical-analysis-course-nagpur\/' rel='post_tag'>technical analysis course Nagpur<\/a>"},"readTime":{"min":15,"sec":42},"status":"publish","excerpt":""},{"id":766,"link":"https:\/\/stockmarketvidya.com\/blogs\/how-dividends-work-earn-passive-income-from-shares-in-the-indian-stock-market\/","name":"how-dividends-work-earn-passive-income-from-shares-in-the-indian-stock-market","thumbnail":{"url":"https:\/\/stockmarketvidya.com\/blogs\/wp-content\/uploads\/2026\/03\/How-Dividends-Work.jpg","alt":"How Dividends Work: Earn Passive Income from Shares in the Indian Stock Market"},"title":"How Dividends Work: Earn Passive Income from Shares in the Indian Stock Market","author":{"name":"Share Market Blog","link":"https:\/\/stockmarketvidya.com\/blogs\/author\/share-market-blog\/"},"date":"Mar 13, 2026","dateGMT":"2026-03-13 07:12:26","modifiedDate":"2026-03-13 07:12:28","modifiedDateGMT":"2026-03-13 07:12:28","commentCount":"0","commentStatus":"open","categories":{"coma":"<a href=\"https:\/\/stockmarketvidya.com\/blogs\/category\/share-market\/\" rel=\"category tag\">Share Market<\/a>, <a href=\"https:\/\/stockmarketvidya.com\/blogs\/category\/share-market-course\/\" rel=\"category tag\">Share Market Course<\/a>","space":"<a href=\"https:\/\/stockmarketvidya.com\/blogs\/category\/share-market\/\" rel=\"category tag\">Share Market<\/a> <a href=\"https:\/\/stockmarketvidya.com\/blogs\/category\/share-market-course\/\" rel=\"category tag\">Share Market Course<\/a>"},"taxonomies":{"post_tag":"<a href='https:\/\/stockmarketvidya.com\/blogs\/tag\/dividend-investing\/' rel='post_tag'>dividend investing<\/a><a href='https:\/\/stockmarketvidya.com\/blogs\/tag\/dividend-stocks-india\/' rel='post_tag'>dividend stocks India<\/a><a href='https:\/\/stockmarketvidya.com\/blogs\/tag\/financial-investing-india\/' rel='post_tag'>financial investing India<\/a><a href='https:\/\/stockmarketvidya.com\/blogs\/tag\/long-term-investing-2\/' rel='post_tag'>long term investing<\/a><a href='https:\/\/stockmarketvidya.com\/blogs\/tag\/passive-income-from-shares\/' rel='post_tag'>passive income from shares<\/a><a href='https:\/\/stockmarketvidya.com\/blogs\/tag\/portfolio-income-investing\/' rel='post_tag'>portfolio income investing<\/a><a href='https:\/\/stockmarketvidya.com\/blogs\/tag\/stock-market-beginners\/' rel='post_tag'>stock market beginners<\/a><a href='https:\/\/stockmarketvidya.com\/blogs\/tag\/stock-market-education\/' rel='post_tag'>Stock market education<\/a><a href='https:\/\/stockmarketvidya.com\/blogs\/tag\/wealth-creation-through-stocks\/' rel='post_tag'>wealth creation through stocks<\/a>"},"readTime":{"min":15,"sec":46},"status":"publish","excerpt":""},{"id":758,"link":"https:\/\/stockmarketvidya.com\/blogs\/small-cap-vs-mid-cap-vs-large-cap-stocks-where-should-smart-investors-in-nagpur-invest\/","name":"small-cap-vs-mid-cap-vs-large-cap-stocks-where-should-smart-investors-in-nagpur-invest","thumbnail":{"url":"https:\/\/stockmarketvidya.com\/blogs\/wp-content\/uploads\/2026\/03\/Small-Cap-vs-Mid-Cap-vs-Large-Cap-Stocks.jpg","alt":"Small Cap vs Mid Cap vs Large Cap Stocks: Where Should Smart Investors in Nagpur Invest?"},"title":"Small Cap vs Mid Cap vs Large Cap Stocks: Where Should Smart Investors in Nagpur Invest?","author":{"name":"Share Market Blog","link":"https:\/\/stockmarketvidya.com\/blogs\/author\/share-market-blog\/"},"date":"Mar 6, 2026","dateGMT":"2026-03-06 01:00:00","modifiedDate":"2026-03-04 11:33:11","modifiedDateGMT":"2026-03-04 11:33:11","commentCount":"0","commentStatus":"open","categories":{"coma":"<a href=\"https:\/\/stockmarketvidya.com\/blogs\/category\/share-market\/\" rel=\"category tag\">Share Market<\/a>, <a href=\"https:\/\/stockmarketvidya.com\/blogs\/category\/share-market-course\/\" rel=\"category tag\">Share Market Course<\/a>","space":"<a href=\"https:\/\/stockmarketvidya.com\/blogs\/category\/share-market\/\" rel=\"category tag\">Share Market<\/a> <a href=\"https:\/\/stockmarketvidya.com\/blogs\/category\/share-market-course\/\" rel=\"category tag\">Share Market Course<\/a>"},"taxonomies":{"post_tag":"<a href='https:\/\/stockmarketvidya.com\/blogs\/tag\/difference-between-small-mid-large-cap\/' rel='post_tag'>difference between small mid large cap<\/a><a href='https:\/\/stockmarketvidya.com\/blogs\/tag\/equity-investment-guide\/' rel='post_tag'>equity investment guide<\/a><a href='https:\/\/stockmarketvidya.com\/blogs\/tag\/investment-strategy-india-portfolio-diversification\/' rel='post_tag'>investment strategy India portfolio diversification<\/a><a href='https:\/\/stockmarketvidya.com\/blogs\/tag\/market-capitalization-explained\/' rel='post_tag'>market capitalization explained<\/a><a href='https:\/\/stockmarketvidya.com\/blogs\/tag\/market-cycles-investing\/' rel='post_tag'>market cycles investing<\/a><a href='https:\/\/stockmarketvidya.com\/blogs\/tag\/nifty-midcap-150\/' rel='post_tag'>NIFTY Midcap 150<\/a><a href='https:\/\/stockmarketvidya.com\/blogs\/tag\/nifty-smallcap-250\/' rel='post_tag'>NIFTY Smallcap 250<\/a><a href='https:\/\/stockmarketvidya.com\/blogs\/tag\/risk-management-in-stock-market-long-term-investing-india\/' rel='post_tag'>risk management in stock market long term investing India<\/a><a href='https:\/\/stockmarketvidya.com\/blogs\/tag\/sebi-stock-classification\/' rel='post_tag'>SEBI stock classification<\/a><a href='https:\/\/stockmarketvidya.com\/blogs\/tag\/share-market-classes-nagpur\/' rel='post_tag'>share market classes Nagpur<\/a><a href='https:\/\/stockmarketvidya.com\/blogs\/tag\/share-trading-classes-nagpur\/' rel='post_tag'>Share Trading Classes Nagpur<\/a><a href='https:\/\/stockmarketvidya.com\/blogs\/tag\/stock-market-course-nagpur\/' rel='post_tag'>Stock Market Course Nagpur<\/a><a href='https:\/\/stockmarketvidya.com\/blogs\/tag\/stock-market-training-nagpur\/' rel='post_tag'>stock market training Nagpur<\/a><a href='https:\/\/stockmarketvidya.com\/blogs\/tag\/stock-market-vidya\/' rel='post_tag'>Stock Market Vidya<\/a>"},"readTime":{"min":9,"sec":59},"status":"publish","excerpt":""},{"id":760,"link":"https:\/\/stockmarketvidya.com\/blogs\/stock-exchanges-explained-in-simple-words-nse-vs-bse-which-one-matters-for-you-as-a-trader\/","name":"stock-exchanges-explained-in-simple-words-nse-vs-bse-which-one-matters-for-you-as-a-trader","thumbnail":{"url":"https:\/\/stockmarketvidya.com\/blogs\/wp-content\/uploads\/2026\/03\/NSE-vs-BSE.jpg","alt":"Stock Exchanges Explained in Simple Words: NSE vs BSE \u2013 Which One Matters for You as a Trader?"},"title":"Stock Exchanges Explained in Simple Words: NSE vs BSE \u2013 Which One Matters for You as a Trader?","author":{"name":"Share Market Blog","link":"https:\/\/stockmarketvidya.com\/blogs\/author\/share-market-blog\/"},"date":"Mar 4, 2026","dateGMT":"2026-03-04 10:54:30","modifiedDate":"2026-03-04 10:54:31","modifiedDateGMT":"2026-03-04 10:54:31","commentCount":"0","commentStatus":"open","categories":{"coma":"<a href=\"https:\/\/stockmarketvidya.com\/blogs\/category\/share-market\/\" rel=\"category tag\">Share Market<\/a>, <a href=\"https:\/\/stockmarketvidya.com\/blogs\/category\/share-market-course\/\" rel=\"category tag\">Share Market Course<\/a>","space":"<a href=\"https:\/\/stockmarketvidya.com\/blogs\/category\/share-market\/\" rel=\"category tag\">Share Market<\/a> <a href=\"https:\/\/stockmarketvidya.com\/blogs\/category\/share-market-course\/\" rel=\"category tag\">Share Market Course<\/a>"},"taxonomies":{"post_tag":"<a href='https:\/\/stockmarketvidya.com\/blogs\/tag\/equity-market-india\/' rel='post_tag'>equity market India<\/a><a href='https:\/\/stockmarketvidya.com\/blogs\/tag\/futures-and-options-nse\/' rel='post_tag'>Futures and Options NSE<\/a><a href='https:\/\/stockmarketvidya.com\/blogs\/tag\/market-depth-analysis\/' rel='post_tag'>market depth analysis<\/a><a href='https:\/\/stockmarketvidya.com\/blogs\/tag\/order-matching-system\/' rel='post_tag'>order matching system<\/a><a href='https:\/\/stockmarketvidya.com\/blogs\/tag\/share-market-course-nagpur\/' rel='post_tag'>share market course Nagpur<\/a><a href='https:\/\/stockmarketvidya.com\/blogs\/tag\/share-trading-classes-nagpur\/' rel='post_tag'>Share Trading Classes Nagpur<\/a><a href='https:\/\/stockmarketvidya.com\/blogs\/tag\/stock-market-basics\/' rel='post_tag'>stock market basics<\/a><a href='https:\/\/stockmarketvidya.com\/blogs\/tag\/stock-market-for-beginners\/' rel='post_tag'>Stock market for beginners<\/a><a href='https:\/\/stockmarketvidya.com\/blogs\/tag\/stock-market-training-nagpur\/' rel='post_tag'>stock market training Nagpur<\/a><a href='https:\/\/stockmarketvidya.com\/blogs\/tag\/stock-market-vidya-nagpur\/' rel='post_tag'>Stock Market Vidya Nagpur<\/a><a href='https:\/\/stockmarketvidya.com\/blogs\/tag\/t1-settlement-cycle\/' rel='post_tag'>T+1 settlement cycle<\/a><a href='https:\/\/stockmarketvidya.com\/blogs\/tag\/trading-education-india\/' rel='post_tag'>trading education india<\/a>"},"readTime":{"min":11,"sec":24},"status":"publish","excerpt":""},{"id":744,"link":"https:\/\/stockmarketvidya.com\/blogs\/etf-is-the-smartest-investment-choice-today-a-practical-guide-for-modern-investors\/","name":"etf-is-the-smartest-investment-choice-today-a-practical-guide-for-modern-investors","thumbnail":{"url":"https:\/\/stockmarketvidya.com\/blogs\/wp-content\/uploads\/2026\/02\/ETF-Is-the-Smartest-Investment-Choice-Today-2.jpg","alt":""},"title":"ETF Is the Smartest Investment Choice Today \u2013 A Practical Guide for Modern Investors","author":{"name":"Share Market Blog","link":"https:\/\/stockmarketvidya.com\/blogs\/author\/share-market-blog\/"},"date":"Feb 26, 2026","dateGMT":"2026-02-26 12:29:32","modifiedDate":"2026-02-26 12:30:23","modifiedDateGMT":"2026-02-26 12:30:23","commentCount":"0","commentStatus":"open","categories":{"coma":"<a href=\"https:\/\/stockmarketvidya.com\/blogs\/category\/share-market\/\" rel=\"category tag\">Share Market<\/a>","space":"<a href=\"https:\/\/stockmarketvidya.com\/blogs\/category\/share-market\/\" rel=\"category tag\">Share Market<\/a>"},"taxonomies":{"post_tag":""},"readTime":{"min":10,"sec":51},"status":"publish","excerpt":""},{"id":739,"link":"https:\/\/stockmarketvidya.com\/blogs\/short-strangle-strategy-in-a-sideways-market\/","name":"short-strangle-strategy-in-a-sideways-market","thumbnail":{"url":"https:\/\/stockmarketvidya.com\/blogs\/wp-content\/uploads\/2026\/02\/Short-Strangle-Strategy-in-a-marketing-Experts.png","alt":"Short Strangle Strategy in a Sideways Market"},"title":"Short Strangle Strategy in a Sideways Market","author":{"name":"Share Market Blog","link":"https:\/\/stockmarketvidya.com\/blogs\/author\/share-market-blog\/"},"date":"Feb 22, 2026","dateGMT":"2026-02-22 01:00:00","modifiedDate":"2026-02-20 07:38:34","modifiedDateGMT":"2026-02-20 07:38:34","commentCount":"0","commentStatus":"open","categories":{"coma":"<a href=\"https:\/\/stockmarketvidya.com\/blogs\/category\/share-market\/\" rel=\"category tag\">Share Market<\/a>, <a href=\"https:\/\/stockmarketvidya.com\/blogs\/category\/share-market-course\/\" rel=\"category tag\">Share Market Course<\/a>","space":"<a href=\"https:\/\/stockmarketvidya.com\/blogs\/category\/share-market\/\" rel=\"category tag\">Share Market<\/a> <a href=\"https:\/\/stockmarketvidya.com\/blogs\/category\/share-market-course\/\" rel=\"category tag\">Share Market Course<\/a>"},"taxonomies":{"post_tag":""},"readTime":{"min":9,"sec":24},"status":"publish","excerpt":""},{"id":734,"link":"https:\/\/stockmarketvidya.com\/blogs\/buy-strangle-strategy-in-a-volatile-market-how-smart-traders-profit-from-big-price-moves\/","name":"buy-strangle-strategy-in-a-volatile-market-how-smart-traders-profit-from-big-price-moves","thumbnail":{"url":"https:\/\/stockmarketvidya.com\/blogs\/wp-content\/uploads\/2026\/02\/Buy-Strangle-Strategy-in-a-Volatile-Market.jpg","alt":"Buy Strangle Strategy in a Volatile Market: How Smart Traders Profit from Big Price Moves"},"title":"Buy Strangle Strategy in a Volatile Market: How Smart Traders Profit from Big Price Moves","author":{"name":"Share Market Blog","link":"https:\/\/stockmarketvidya.com\/blogs\/author\/share-market-blog\/"},"date":"Feb 20, 2026","dateGMT":"2026-02-20 06:36:50","modifiedDate":"2026-02-20 06:36:52","modifiedDateGMT":"2026-02-20 06:36:52","commentCount":"0","commentStatus":"open","categories":{"coma":"<a href=\"https:\/\/stockmarketvidya.com\/blogs\/category\/share-market\/\" rel=\"category tag\">Share Market<\/a>, <a href=\"https:\/\/stockmarketvidya.com\/blogs\/category\/share-market-course\/\" rel=\"category tag\">Share Market Course<\/a>","space":"<a href=\"https:\/\/stockmarketvidya.com\/blogs\/category\/share-market\/\" rel=\"category tag\">Share Market<\/a> <a href=\"https:\/\/stockmarketvidya.com\/blogs\/category\/share-market-course\/\" rel=\"category tag\">Share Market Course<\/a>"},"taxonomies":{"post_tag":""},"readTime":{"min":8,"sec":20},"status":"publish","excerpt":""},{"id":727,"link":"https:\/\/stockmarketvidya.com\/blogs\/short-straddle-in-sideways-market-a-complete-traders-perspective\/","name":"short-straddle-in-sideways-market-a-complete-traders-perspective","thumbnail":{"url":"https:\/\/stockmarketvidya.com\/blogs\/wp-content\/uploads\/2026\/02\/Short-Straddle-in-Sideways-Market.jpg","alt":"Short Straddle in Sideways Market: A Complete Trader\u2019s Perspective"},"title":"Short Straddle in Sideways Market: A Complete Trader\u2019s Perspective","author":{"name":"Share Market Blog","link":"https:\/\/stockmarketvidya.com\/blogs\/author\/share-market-blog\/"},"date":"Feb 13, 2026","dateGMT":"2026-02-13 01:55:00","modifiedDate":"2026-02-11 06:28:05","modifiedDateGMT":"2026-02-11 06:28:05","commentCount":"0","commentStatus":"open","categories":{"coma":"<a href=\"https:\/\/stockmarketvidya.com\/blogs\/category\/share-market\/\" rel=\"category tag\">Share Market<\/a>","space":"<a href=\"https:\/\/stockmarketvidya.com\/blogs\/category\/share-market\/\" rel=\"category tag\">Share Market<\/a>"},"taxonomies":{"post_tag":"<a href='https:\/\/stockmarketvidya.com\/blogs\/tag\/bank-nifty-option-selling-strategy\/' rel='post_tag'>BANK NIFTY option selling strategy<\/a><a href='https:\/\/stockmarketvidya.com\/blogs\/tag\/best-share-market-classes-in-nagpur\/' rel='post_tag'>Best share market classes in Nagpur<\/a><a href='https:\/\/stockmarketvidya.com\/blogs\/tag\/expiry-day-trading-strategy\/' rel='post_tag'>expiry day trading strategy<\/a><a href='https:\/\/stockmarketvidya.com\/blogs\/tag\/nifty-short-straddle\/' rel='post_tag'>NIFTY Short Straddle<\/a><a href='https:\/\/stockmarketvidya.com\/blogs\/tag\/nism-certified-trainer-nagpur\/' rel='post_tag'>NISM Certified Trainer Nagpur<\/a><a href='https:\/\/stockmarketvidya.com\/blogs\/tag\/non-directional-options-strategy\/' rel='post_tag'>Non Directional Options Strategy<\/a><a href='https:\/\/stockmarketvidya.com\/blogs\/tag\/option-selling-course-nagpur\/' rel='post_tag'>option selling course Nagpur<\/a><a href='https:\/\/stockmarketvidya.com\/blogs\/tag\/option-selling-strategy\/' rel='post_tag'>option selling strategy<\/a><a href='https:\/\/stockmarketvidya.com\/blogs\/tag\/options-trading-for-beginners\/' rel='post_tag'>Options trading for beginners<\/a><a href='https:\/\/stockmarketvidya.com\/blogs\/tag\/premium-decay-strategy\/' rel='post_tag'>premium decay strategy<\/a><a href='https:\/\/stockmarketvidya.com\/blogs\/tag\/professional-stock-market-training\/' rel='post_tag'>professional stock market training<\/a><a href='https:\/\/stockmarketvidya.com\/blogs\/tag\/range-bound-market-strategy\/' rel='post_tag'>range bound market strategy<\/a><a href='https:\/\/stockmarketvidya.com\/blogs\/tag\/share-market-classes-in-nagpur\/' rel='post_tag'>Share Market Classes in Nagpur<\/a><a href='https:\/\/stockmarketvidya.com\/blogs\/tag\/share-market-training-in-nagpur\/' rel='post_tag'>share market training in Nagpur<\/a><a href='https:\/\/stockmarketvidya.com\/blogs\/tag\/short-straddle-in-sideways-market\/' rel='post_tag'>Short Straddle in sideways market<\/a><a href='https:\/\/stockmarketvidya.com\/blogs\/tag\/short-straddle-strategy\/' rel='post_tag'>Short Straddle strategy<\/a><a href='https:\/\/stockmarketvidya.com\/blogs\/tag\/sideways-market-trading-strategy\/' rel='post_tag'>sideways market trading strategy<\/a><a href='https:\/\/stockmarketvidya.com\/blogs\/tag\/stock-market-course-near-me\/' rel='post_tag'>stock market course near me<\/a><a href='https:\/\/stockmarketvidya.com\/blogs\/tag\/stock-market-vidya-nagpur\/' rel='post_tag'>Stock Market Vidya Nagpur<\/a><a href='https:\/\/stockmarketvidya.com\/blogs\/tag\/time-decay-trading-strategy\/' rel='post_tag'>time decay trading strategy<\/a><a href='https:\/\/stockmarketvidya.com\/blogs\/tag\/volatility-based-option-selling\/' rel='post_tag'>volatility based option selling<\/a>"},"readTime":{"min":8,"sec":31},"status":"publish","excerpt":""},{"id":720,"link":"https:\/\/stockmarketvidya.com\/blogs\/buy-straddle-strategy-in-a-volatile-market-how-smart-traders-trade-big-moves-without-predicting-direction\/","name":"buy-straddle-strategy-in-a-volatile-market-how-smart-traders-trade-big-moves-without-predicting-direction","thumbnail":{"url":"https:\/\/stockmarketvidya.com\/blogs\/wp-content\/uploads\/2026\/02\/Buy-Straddle-Strategy-in-a-Volatile-Market.jpg","alt":"Buy Straddle Strategy in a Volatile Market: How Smart Traders Trade Big Moves Without Predicting Direction"},"title":"Buy Straddle Strategy in a Volatile Market: How Smart Traders Trade Big Moves Without Predicting Direction","author":{"name":"Share Market Blog","link":"https:\/\/stockmarketvidya.com\/blogs\/author\/share-market-blog\/"},"date":"Feb 11, 2026","dateGMT":"2026-02-11 05:52:31","modifiedDate":"2026-02-11 06:39:48","modifiedDateGMT":"2026-02-11 06:39:48","commentCount":"1","commentStatus":"open","categories":{"coma":"<a href=\"https:\/\/stockmarketvidya.com\/blogs\/category\/share-market\/\" rel=\"category tag\">Share Market<\/a>","space":"<a href=\"https:\/\/stockmarketvidya.com\/blogs\/category\/share-market\/\" rel=\"category tag\">Share Market<\/a>"},"taxonomies":{"post_tag":"<a href='https:\/\/stockmarketvidya.com\/blogs\/tag\/banknifty-straddle-strategy\/' rel='post_tag'>BANKNIFTY straddle strategy<\/a><a href='https:\/\/stockmarketvidya.com\/blogs\/tag\/best-share-market-classes-in-nagpur\/' rel='post_tag'>Best share market classes in Nagpur<\/a><a href='https:\/\/stockmarketvidya.com\/blogs\/tag\/buy-straddle-in-volatile-market\/' rel='post_tag'>Buy Straddle in volatile market<\/a><a href='https:\/\/stockmarketvidya.com\/blogs\/tag\/buy-straddle-strategy\/' rel='post_tag'>Buy Straddle strategy<\/a><a href='https:\/\/stockmarketvidya.com\/blogs\/tag\/direction-neutral-trading-strategy\/' rel='post_tag'>direction neutral trading strategy<\/a><a href='https:\/\/stockmarketvidya.com\/blogs\/tag\/event-based-trading\/' rel='post_tag'>event based trading<\/a><a href='https:\/\/stockmarketvidya.com\/blogs\/tag\/how-to-trade-straddle\/' rel='post_tag'>how to trade straddle<\/a><a href='https:\/\/stockmarketvidya.com\/blogs\/tag\/intraday-options-strategy\/' rel='post_tag'>intraday options strategy<\/a><a href='https:\/\/stockmarketvidya.com\/blogs\/tag\/nifty-options-strategy\/' rel='post_tag'>Nifty Options Strategy<\/a><a href='https:\/\/stockmarketvidya.com\/blogs\/tag\/nism-certified-trainer-nagpur\/' rel='post_tag'>NISM Certified Trainer Nagpur<\/a><a href='https:\/\/stockmarketvidya.com\/blogs\/tag\/options-trading-course-nagpur\/' rel='post_tag'>options trading course Nagpur<\/a><a href='https:\/\/stockmarketvidya.com\/blogs\/tag\/options-trading-for-beginners\/' rel='post_tag'>Options trading for beginners<\/a><a href='https:\/\/stockmarketvidya.com\/blogs\/tag\/options-trading-strategy\/' rel='post_tag'>Options trading strategy<\/a><a href='https:\/\/stockmarketvidya.com\/blogs\/tag\/risk-management-in-options-trading\/' rel='post_tag'>risk management in options trading<\/a><a href='https:\/\/stockmarketvidya.com\/blogs\/tag\/share-market-classes-in-nagpur\/' rel='post_tag'>Share Market Classes in Nagpur<\/a><a href='https:\/\/stockmarketvidya.com\/blogs\/tag\/share-market-training-in-nagpur\/' rel='post_tag'>share market training in Nagpur<\/a><a href='https:\/\/stockmarketvidya.com\/blogs\/tag\/stock-market-course-near-me\/' rel='post_tag'>stock market course near me<\/a><a href='https:\/\/stockmarketvidya.com\/blogs\/tag\/stock-market-vidya-nagpur\/' rel='post_tag'>Stock Market Vidya Nagpur<\/a><a href='https:\/\/stockmarketvidya.com\/blogs\/tag\/volatility-based-trading\/' rel='post_tag'>volatility based trading<\/a><a href='https:\/\/stockmarketvidya.com\/blogs\/tag\/volatility-trading-strategy\/' rel='post_tag'>volatility trading strategy<\/a>"},"readTime":{"min":8,"sec":47},"status":"publish","excerpt":""},{"id":708,"link":"https:\/\/stockmarketvidya.com\/blogs\/iron-condor-strategy-explained-learn-smart-options-trading-the-right-way\/","name":"iron-condor-strategy-explained-learn-smart-options-trading-the-right-way","thumbnail":{"url":"https:\/\/stockmarketvidya.com\/blogs\/wp-content\/uploads\/2026\/02\/Iron-Condor-Strategy-Explained-\u2013-1.jpg","alt":"Iron Condor Strategy Explained"},"title":"Iron Condor Strategy Explained \u2013 Learn Smart Options Trading the Right Way","author":{"name":"Share Market Blog","link":"https:\/\/stockmarketvidya.com\/blogs\/author\/share-market-blog\/"},"date":"Feb 5, 2026","dateGMT":"2026-02-05 01:17:00","modifiedDate":"2026-02-04 15:19:56","modifiedDateGMT":"2026-02-04 15:19:56","commentCount":"0","commentStatus":"open","categories":{"coma":"<a href=\"https:\/\/stockmarketvidya.com\/blogs\/category\/share-market\/\" rel=\"category tag\">Share Market<\/a>, <a href=\"https:\/\/stockmarketvidya.com\/blogs\/category\/share-market-course\/\" rel=\"category tag\">Share Market Course<\/a>","space":"<a href=\"https:\/\/stockmarketvidya.com\/blogs\/category\/share-market\/\" rel=\"category tag\">Share Market<\/a> <a href=\"https:\/\/stockmarketvidya.com\/blogs\/category\/share-market-course\/\" rel=\"category tag\">Share Market Course<\/a>"},"taxonomies":{"post_tag":"<a href='https:\/\/stockmarketvidya.com\/blogs\/tag\/advanced-options-trading\/' rel='post_tag'>Advanced Options Trading<\/a><a href='https:\/\/stockmarketvidya.com\/blogs\/tag\/bank-nifty-iron-condor\/' rel='post_tag'>BANK NIFTY Iron Condor<\/a><a href='https:\/\/stockmarketvidya.com\/blogs\/tag\/iron-condor-options-trading\/' rel='post_tag'>Iron Condor Options Trading<\/a><a href='https:\/\/stockmarketvidya.com\/blogs\/tag\/iron-condor-strategy\/' rel='post_tag'>iron condor strategy<\/a><a href='https:\/\/stockmarketvidya.com\/blogs\/tag\/nifty-iron-condor\/' rel='post_tag'>NIFTY Iron Condor<\/a><a href='https:\/\/stockmarketvidya.com\/blogs\/tag\/nism-certified-trainer\/' rel='post_tag'>NISM Certified Trainer<\/a><a href='https:\/\/stockmarketvidya.com\/blogs\/tag\/non-directional-options-strategy\/' rel='post_tag'>Non Directional Options Strategy<\/a><a href='https:\/\/stockmarketvidya.com\/blogs\/tag\/option-selling-strategies\/' rel='post_tag'>Option Selling Strategies<\/a><a href='https:\/\/stockmarketvidya.com\/blogs\/tag\/options-selling-strategy\/' rel='post_tag'>Options selling strategy<\/a><a href='https:\/\/stockmarketvidya.com\/blogs\/tag\/options-trading-course\/' rel='post_tag'>options trading course<\/a><a href='https:\/\/stockmarketvidya.com\/blogs\/tag\/options-trading-for-beginners\/' rel='post_tag'>Options trading for beginners<\/a><a href='https:\/\/stockmarketvidya.com\/blogs\/tag\/professional-options-trading\/' rel='post_tag'>professional options trading<\/a><a href='https:\/\/stockmarketvidya.com\/blogs\/tag\/risk-managed-trading\/' rel='post_tag'>Risk Managed Trading<\/a><a href='https:\/\/stockmarketvidya.com\/blogs\/tag\/share-market-classes-in-nagpur\/' rel='post_tag'>Share Market Classes in Nagpur<\/a><a href='https:\/\/stockmarketvidya.com\/blogs\/tag\/stock-market-training-nagpur\/' rel='post_tag'>stock market training Nagpur<\/a><a href='https:\/\/stockmarketvidya.com\/blogs\/tag\/theta-decay-strategy\/' rel='post_tag'>Theta Decay Strategy<\/a><a href='https:\/\/stockmarketvidya.com\/blogs\/tag\/volatility-trading\/' rel='post_tag'>Volatility Trading<\/a>"},"readTime":{"min":5,"sec":57},"status":"publish","excerpt":""},{"id":704,"link":"https:\/\/stockmarketvidya.com\/blogs\/iron-collar-strategy-explained-smart-risk-control-options-strategy-for-indian-traders\/","name":"iron-collar-strategy-explained-smart-risk-control-options-strategy-for-indian-traders","thumbnail":{"url":"https:\/\/stockmarketvidya.com\/blogs\/wp-content\/uploads\/2026\/02\/Iron-Collar-Strategy-Explained.jpg","alt":"Iron Collar Strategy Explained: Smart Risk Control Options Strategy for Indian Traders"},"title":"Iron Collar Strategy Explained: Smart Risk Control Options Strategy for Indian Traders","author":{"name":"Share Market Blog","link":"https:\/\/stockmarketvidya.com\/blogs\/author\/share-market-blog\/"},"date":"Feb 3, 2026","dateGMT":"2026-02-03 10:48:33","modifiedDate":"2026-02-03 10:48:34","modifiedDateGMT":"2026-02-03 10:48:34","commentCount":"0","commentStatus":"open","categories":{"coma":"<a href=\"https:\/\/stockmarketvidya.com\/blogs\/category\/share-market\/\" rel=\"category tag\">Share Market<\/a>, <a href=\"https:\/\/stockmarketvidya.com\/blogs\/category\/share-market-course\/\" rel=\"category tag\">Share Market Course<\/a>","space":"<a href=\"https:\/\/stockmarketvidya.com\/blogs\/category\/share-market\/\" rel=\"category tag\">Share Market<\/a> <a href=\"https:\/\/stockmarketvidya.com\/blogs\/category\/share-market-course\/\" rel=\"category tag\">Share Market Course<\/a>"},"taxonomies":{"post_tag":"<a href='https:\/\/stockmarketvidya.com\/blogs\/tag\/advanced-options-strategies\/' rel='post_tag'>Advanced Options Strategies<\/a><a href='https:\/\/stockmarketvidya.com\/blogs\/tag\/best-share-market-classes-in-nagpur\/' rel='post_tag'>Best share market classes in Nagpur<\/a><a href='https:\/\/stockmarketvidya.com\/blogs\/tag\/capital-protection-strategy\/' rel='post_tag'>capital protection strategy<\/a><a href='https:\/\/stockmarketvidya.com\/blogs\/tag\/defined-risk-trading\/' rel='post_tag'>defined risk trading<\/a><a href='https:\/\/stockmarketvidya.com\/blogs\/tag\/hedged-options-trading\/' rel='post_tag'>hedged options trading<\/a><a href='https:\/\/stockmarketvidya.com\/blogs\/tag\/indian-stock-market-options\/' rel='post_tag'>Indian stock market options<\/a><a href='https:\/\/stockmarketvidya.com\/blogs\/tag\/iron-collar-options-strategy\/' rel='post_tag'>iron collar options strategy<\/a><a href='https:\/\/stockmarketvidya.com\/blogs\/tag\/iron-collar-strategy\/' rel='post_tag'>iron collar strategy<\/a><a href='https:\/\/stockmarketvidya.com\/blogs\/tag\/limited-risk-options-strategy\/' rel='post_tag'>limited risk options strategy<\/a><a href='https:\/\/stockmarketvidya.com\/blogs\/tag\/option-selling-strategy\/' rel='post_tag'>option selling strategy<\/a><a href='https:\/\/stockmarketvidya.com\/blogs\/tag\/options-hedging-strategy\/' rel='post_tag'>options hedging strategy<\/a><a href='https:\/\/stockmarketvidya.com\/blogs\/tag\/options-trading-course-nagpur\/' rel='post_tag'>options trading course Nagpur<\/a><a href='https:\/\/stockmarketvidya.com\/blogs\/tag\/options-trading-for-beginners\/' rel='post_tag'>Options trading for beginners<\/a><a href='https:\/\/stockmarketvidya.com\/blogs\/tag\/options-trading-in-india\/' rel='post_tag'>Options Trading in India<\/a><a href='https:\/\/stockmarketvidya.com\/blogs\/tag\/options-trading-strategy\/' rel='post_tag'>Options trading strategy<\/a><a href='https:\/\/stockmarketvidya.com\/blogs\/tag\/prashant-sarode-nism-certified\/' rel='post_tag'>Prashant Sarode NISM certified<\/a><a href='https:\/\/stockmarketvidya.com\/blogs\/tag\/professional-options-trading\/' rel='post_tag'>professional options trading<\/a><a href='https:\/\/stockmarketvidya.com\/blogs\/tag\/risk-control-in-options-trading\/' rel='post_tag'>risk control in options trading<\/a><a href='https:\/\/stockmarketvidya.com\/blogs\/tag\/rule-based-trading\/' rel='post_tag'>rule based trading<\/a><a href='https:\/\/stockmarketvidya.com\/blogs\/tag\/share-market-training-in-nagpur\/' rel='post_tag'>share market training in Nagpur<\/a><a href='https:\/\/stockmarketvidya.com\/blogs\/tag\/share-trading-classes-in-nagpur\/' rel='post_tag'>share trading classes in Nagpur<\/a><a href='https:\/\/stockmarketvidya.com\/blogs\/tag\/sideways-market-options-strategy\/' rel='post_tag'>sideways market options strategy<\/a><a href='https:\/\/stockmarketvidya.com\/blogs\/tag\/smart-options-trading\/' rel='post_tag'>smart options trading<\/a><a href='https:\/\/stockmarketvidya.com\/blogs\/tag\/stock-market-course-in-nagpur\/' rel='post_tag'>stock market course in Nagpur<\/a><a href='https:\/\/stockmarketvidya.com\/blogs\/tag\/stock-market-training\/' rel='post_tag'>Stock Market Training<\/a><a href='https:\/\/stockmarketvidya.com\/blogs\/tag\/stock-market-vidya-nagpur\/' rel='post_tag'>Stock Market Vidya Nagpur<\/a><a href='https:\/\/stockmarketvidya.com\/blogs\/tag\/stock-options-trading\/' rel='post_tag'>stock options trading<\/a><a href='https:\/\/stockmarketvidya.com\/blogs\/tag\/trading-psychology\/' rel='post_tag'>Trading Psychology<\/a>"},"readTime":{"min":5,"sec":58},"status":"publish","excerpt":""},{"id":696,"link":"https:\/\/stockmarketvidya.com\/blogs\/bear-put-spread-strategy-explained-a-smart-options-trading-method-for-falling-markets\/","name":"bear-put-spread-strategy-explained-a-smart-options-trading-method-for-falling-markets","thumbnail":{"url":"https:\/\/stockmarketvidya.com\/blogs\/wp-content\/uploads\/2026\/01\/Bear-Put-Spread-Strategy-Explained.jpg","alt":"Bear Put Spread Strategy - Stock Marketing Training Nagpur"},"title":"Bear Put Spread Strategy Explained: A Smart Options Trading Method for Falling Markets","author":{"name":"Share Market Blog","link":"https:\/\/stockmarketvidya.com\/blogs\/author\/share-market-blog\/"},"date":"Jan 31, 2026","dateGMT":"2026-01-31 01:00:00","modifiedDate":"2026-01-30 14:47:36","modifiedDateGMT":"2026-01-30 14:47:36","commentCount":"0","commentStatus":"open","categories":{"coma":"<a href=\"https:\/\/stockmarketvidya.com\/blogs\/category\/share-market\/\" rel=\"category tag\">Share Market<\/a>, <a href=\"https:\/\/stockmarketvidya.com\/blogs\/category\/share-market-course\/\" rel=\"category tag\">Share Market Course<\/a>","space":"<a href=\"https:\/\/stockmarketvidya.com\/blogs\/category\/share-market\/\" rel=\"category tag\">Share Market<\/a> <a href=\"https:\/\/stockmarketvidya.com\/blogs\/category\/share-market-course\/\" rel=\"category tag\">Share Market Course<\/a>"},"taxonomies":{"post_tag":"<a href='https:\/\/stockmarketvidya.com\/blogs\/tag\/bank-nifty-options\/' rel='post_tag'>Bank Nifty options<\/a><a href='https:\/\/stockmarketvidya.com\/blogs\/tag\/bear-put-spread\/' rel='post_tag'>Bear Put Spread<\/a><a href='https:\/\/stockmarketvidya.com\/blogs\/tag\/bear-put-spread-strategy\/' rel='post_tag'>Bear Put Spread Strategy<\/a><a href='https:\/\/stockmarketvidya.com\/blogs\/tag\/bearish-options-strategy\/' rel='post_tag'>Bearish Options Strategy<\/a><a href='https:\/\/stockmarketvidya.com\/blogs\/tag\/best-share-market-classes-in-nagpur\/' rel='post_tag'>Best share market classes in Nagpur<\/a><a href='https:\/\/stockmarketvidya.com\/blogs\/tag\/nifty-options-strategy\/' rel='post_tag'>Nifty Options Strategy<\/a><a href='https:\/\/stockmarketvidya.com\/blogs\/tag\/options-trading-basics\/' rel='post_tag'>Options trading basics<\/a><a href='https:\/\/stockmarketvidya.com\/blogs\/tag\/options-trading-for-beginners\/' rel='post_tag'>Options trading for beginners<\/a><a href='https:\/\/stockmarketvidya.com\/blogs\/tag\/options-trading-strategy\/' rel='post_tag'>Options trading strategy<\/a><a href='https:\/\/stockmarketvidya.com\/blogs\/tag\/professional-trading-strategies\/' rel='post_tag'>Professional Trading Strategies<\/a><a href='https:\/\/stockmarketvidya.com\/blogs\/tag\/share-market-classes\/' rel='post_tag'>Share Market Classes<\/a><a href='https:\/\/stockmarketvidya.com\/blogs\/tag\/share-market-course\/' rel='post_tag'>Share Market Course<\/a><a href='https:\/\/stockmarketvidya.com\/blogs\/tag\/share-market-course-in-nagpur\/' rel='post_tag'>Share Market Course in Nagpur<\/a><a href='https:\/\/stockmarketvidya.com\/blogs\/tag\/share-market-training\/' rel='post_tag'>Share Market Training<\/a><a href='https:\/\/stockmarketvidya.com\/blogs\/tag\/share-market-training-in-nagpur\/' rel='post_tag'>share market training in Nagpur<\/a><a href='https:\/\/stockmarketvidya.com\/blogs\/tag\/share-trading-classes-in-nagpur\/' rel='post_tag'>share trading classes in Nagpur<\/a><a href='https:\/\/stockmarketvidya.com\/blogs\/tag\/stock-market-course\/' rel='post_tag'>Stock Market Course<\/a><a href='https:\/\/stockmarketvidya.com\/blogs\/tag\/stock-market-training\/' rel='post_tag'>Stock Market Training<\/a><a href='https:\/\/stockmarketvidya.com\/blogs\/tag\/stock-market-vidya\/' rel='post_tag'>Stock Market Vidya<\/a>"},"readTime":{"min":9,"sec":19},"status":"publish","excerpt":""}]