In the world of technical analysis, some indicators are simple, some are complex, and some become an everyday companion for both beginners and professionals. Bollinger Bands fall into the third category. They adapt to market volatility, reveal hidden momentum, highlight upcoming breakouts, and help traders understand whether a stock is relatively expensive or undervalued at the current moment.
For learners joining share trading classes in Nagpur or searching for the Best share market classes in Nagpur, one concept you will use frequently in charts is Bollinger Bands. This indicator is not only a “tool” but a complete price-behaviour guide. And at Stock Market Vidya Nagpur, run by Mr. Prashant Sarode (NISM Certified Trainer), this indicator is taught with practical real-market examples so that learners truly understand its depth, not just formulas.
In this detailed blog, we are going to walk through everything about Bollinger Bands—what they are, how they work, why they matter, and how traders combine them with powerful strategies.
What Makes Bollinger Bands So Popular Among Traders?
Before diving deep into structure, signals, and strategies, the first big question is this:
Why are Bollinger Bands used by millions of traders worldwide?
Because this indicator adjusts itself based on the stock’s volatility.
When the market becomes silent → the bands squeeze.
When the market becomes aggressive → the bands widen.
When the price becomes too optimistic → the upper band reacts.
When the price becomes too pessimistic → the lower band reacts.
This “dynamic nature” makes Bollinger Bands a living indicator that keeps updating itself with the market’s behaviour. And when students join a stock market course where real charts are used, they quickly understand how valuable this indicator is.
Understanding the Structure of Bollinger Bands
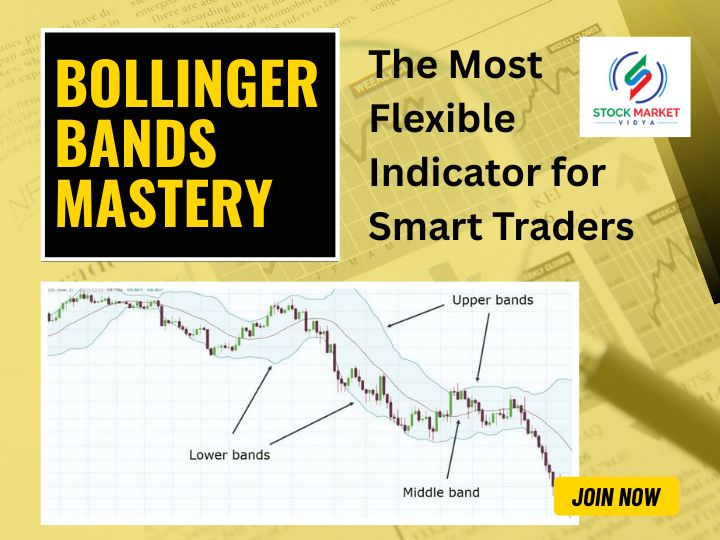
Every indicator has some backbone—some standard rules and components. Bollinger Bands are built around three simple—but powerful—lines:
1. The Middle Band
This is simply a 20-period Simple Moving Average (SMA) by default.
It acts like the core of the indicator.
Price crossing above it shows strength.
Price crossing below it shows weakness.
This 20-SMA is often used as a trend guide by many professional traders.
2. The Upper Band
This line measures how far the price can stretch above its average during high momentum.
It is created by adding a standard deviation (usually 2) to the middle band.
When price touches the upper band, it does not always mean the stock is “overbought”—it simply means price is trading near the higher boundary of its volatility range.
A strong trend can keep hugging the upper band for long durations.
3. The Lower Band
This line measures how far the price can stretch below its average.
It is created by subtracting a standard deviation (usually 2) from the middle band.
Touching the lower band doesn’t always mean “oversold.”
It simply tells traders that the stock is near the lower end of its volatility range.
Why Standard Deviation Matters in Bollinger Bands
Most learners in share market training in Nagpur often ask:
“Why does Bollinger Bands use standard deviation instead of a fixed value?”
Here is the simplified answer:
Because markets do not move in a fixed range. They expand, contract, and sometimes surprise.
Standard deviation measures volatility mathematically, allowing the bands to widen and shrink according to the market condition.
That is why Bollinger Bands are considered one of the most “natural” indicators for price behaviour.
How Traders Read Bollinger Bands Like a Pro
Understanding the structure is the first step. Now let’s decode the real value—the signals.
These readings are the heart of technical analysis and are widely taught in advanced share trading classes in Nagpur.
1. Price at the Upper Band
This is a sign that the stock is trading at the top of its volatility envelope.
It can mean two things:
- Trend is strong and buyers are in control
or
- Price is overstretching and might pull back soon
Which scenario is true depends on additional analysis—volume, candlestick patterns, RSI, etc.
2. Price at the Lower Band
This is the opposite extreme. When the price touches the lower band, it signals:
- Selling is dominant
or
- Price has become undervalued and may bounce
Again, reaction depends on context, not just band touching.
3. Band Squeeze
This is one of the most famous Bollinger Band signals.
A squeeze means the bands come closer—volatility becomes extremely low.
When this happens, it usually indicates:
A strong breakout or breakdown is coming.
This is a powerful signal for swing traders and positional traders.
4. Band Expansion
After long periods of squeezing, bands expand rapidly when volatility increases.
This expansion usually supports the breakout trend.
If price stays near the middle band, it hints at consolidation; if it stays near extremes, it confirms trend strength.
5. Riding the Bands
In trending markets, price can “ride the band”—meaning it moves along the upper or lower band without reversing quickly.
This is where beginners make mistakes—they try to trade against the trend assuming reversal.
Professionals respect trending structure and trade with momentum instead.
Powerful Bollinger Band Strategies Used by Smart Traders
Now comes the most important part. Understanding an indicator is fine, but knowing how to use it strategically is where trading skill develops.
Let’s explore the strongest strategies used by many professionals and taught practically in top institutes like Stock Market Vidya Nagpur.
Strategy 1: Bollinger Band Reversal Trading
This strategy looks for signs that price has stretched too far and may reverse back to the average.
Key steps:
- Price touches either upper or lower band
- A strong candlestick reversal pattern appears
- Volume confirms
- Price attempts to move towards the middle band
This approach is ideal for short-term traders aiming for quick profit opportunities.
Strategy 2: Bollinger Band Breakout Strategy
This strategy is the opposite of the reversal idea.
Here traders look for sudden volatility expansion.
Steps:
- Bands squeeze tightly
- Price breaks out with strong volume
- The middle band acts as trend support
- Traders ride the trend until momentum fades
Breakouts from long squeezes often result in powerful directional moves.
Strategy 3: Using Bollinger Bands With RSI
This is one of the most reliable combinations.
When price touches the band and RSI confirms over-extension, probability of reversal increases sharply.
For example:
- Price hits upper band + RSI overbought → weak buyers, reversal likely
- Price hits lower band + RSI oversold → selling pressure slowing, bounce likely
This multi-indicator confirmation makes trading decisions stronger.
Strategy 4: Bollinger Bands With Price Action
Candlestick patterns like:
- Doji
- Hammer
- Shooting star
- Engulfing patterns
- Pin bars
…become more meaningful when they appear near the bands.
This combination is highly effective for intraday and swing traders.
Bollinger Bands for Trend Trading
Most traders assume BB works only for reversals.
The truth is—Bollinger Bands are also excellent for identifying trend continuation.
Here’s how experts use it:
- Price above the middle band → buyers dominant
- Price consistently touching upper band → strength and breakout potential
- Middle band acts as dynamic support
This logic is taught in professional stock market course modules to help traders avoid counter-trend mistakes.
Bollinger Bands for Intraday Trading
Intraday traders rely heavily on volatility understanding, and Bollinger Bands give a visual representation of volatility.
Benefits for intraday:
- Clear support and resistance zones
- Identifies breakout spots
- Helps spot false breakouts
- Provides dynamic trend direction
- Helps avoid overtrading in flat markets
For students attending share trading classes in Nagpur, this indicator becomes part of nearly every intraday setup.
Common Mistakes Beginners Make With Bollinger Bands
Even though this indicator is powerful, beginners often misuse it.
Here are key mistakes to avoid:
1. Treating Upper Band as Automatic Sell Zone
A stock in a strong uptrend can keep hitting the upper band for days.
2. Treating Lower Band as Automatic Buy Zone
Downtrending stocks can remain weak for longer than expected.
3. Ignoring Volatility Context
A reversal in a low volatility market behaves differently from a reversal in a high volatility phase.
4. Entering Without Confirmation
Relying only on bands without volume, RSI, or price action often leads to false signals.
How Bollinger Bands Improve Trading Psychology
A trader’s confidence grows when the chart speaks clearly. Bollinger Bands help in:
- Controlling over-enthusiasm during uptrends
- Avoiding panic during sudden dips
- Understanding whether price behaviour is normal or extreme
- Managing emotional decisions
These psychological benefits are essential for every trader learning through a structured share market course in Nagpur.
Why Bollinger Bands Are a Core Chapter in Stock Market Vidya Nagpur
At Stock Market Vidya, the teaching is centred not just on tools but on real-world interpretation.
Bollinger Bands are taught using:
- Real-time charts
- Case studies
- Historical movements
- Practical trading examples
This ensures that learners truly master the concept, not just remember definitions.
Many students searching for share market course near me or Best share market classes in Nagpur choose Stock Market Vidya for this reason—practical, simple, and actionable explanations.
Conclusion: Bollinger Bands Are Not Just an Indicator—They Are a Complete Market Behaviour Model
Every stock has a personality—some move sharply, some move slowly, some are noisy and unpredictable.
Bollinger Bands capture this personality.
They show:
- How wide the price is moving
- How calm or energetic the market is
- When price is stretching too far
- When volatility is about to shock traders
- Whether trend is gaining or losing strength
By mastering Bollinger Bands, traders add one of the most adaptive and accurate tools to their skillset.
If you are serious about learning, upgrading your chart-reading skill, or becoming a confident trader, joining proper share market training in Nagpur will help you understand everything more practically.
For Quality Learning in Nagpur
Stock Market Vidya – Share Market Training Institute, Nagpur
Run by Mr. Prashant Sarode (NISM Certified Trainer)
Mobile: 9822718163, 8421893845
Website: www.stockmarketvidya.com
[{"id":791,"link":"https:\/\/stockmarketvidya.com\/blogs\/george-soros-master-of-risk-and-reward\/","name":"george-soros-master-of-risk-and-reward","thumbnail":{"url":"https:\/\/stockmarketvidya.com\/blogs\/wp-content\/uploads\/2026\/03\/George-Soros.jpg","alt":"George Soros: Master of Risk and Reward"},"title":"George Soros: Master of Risk and Reward","author":{"name":"Share Market Blog","link":"https:\/\/stockmarketvidya.com\/blogs\/author\/share-market-blog\/"},"date":"Mar 23, 2026","dateGMT":"2026-03-23 01:05:00","modifiedDate":"2026-03-21 09:06:11","modifiedDateGMT":"2026-03-21 09:06:11","commentCount":"0","commentStatus":"open","categories":{"coma":"<a href=\"https:\/\/stockmarketvidya.com\/blogs\/category\/share-market\/\" rel=\"category tag\">Share Market<\/a>","space":"<a href=\"https:\/\/stockmarketvidya.com\/blogs\/category\/share-market\/\" rel=\"category tag\">Share Market<\/a>"},"taxonomies":{"post_tag":"<a href='https:\/\/stockmarketvidya.com\/blogs\/tag\/black-wednesday-george-soros\/' rel='post_tag'>Black Wednesday George Soros<\/a><a href='https:\/\/stockmarketvidya.com\/blogs\/tag\/george-soros-investing-style\/' rel='post_tag'>George Soros investing style<\/a><a href='https:\/\/stockmarketvidya.com\/blogs\/tag\/george-soros-trading-strategy\/' rel='post_tag'>George Soros trading strategy<\/a><a href='https:\/\/stockmarketvidya.com\/blogs\/tag\/risk-management-in-trading\/' rel='post_tag'>risk management in trading<\/a><a href='https:\/\/stockmarketvidya.com\/blogs\/tag\/stock-market-legends\/' rel='post_tag'>stock market legends<\/a><a href='https:\/\/stockmarketvidya.com\/blogs\/tag\/trading-psychology-lessons\/' rel='post_tag'>trading psychology lessons<\/a>"},"readTime":{"min":8,"sec":34},"status":"publish","excerpt":""},{"id":786,"link":"https:\/\/stockmarketvidya.com\/blogs\/sectoral-investing-identifying-growth-opportunities-in-the-stock-market\/","name":"sectoral-investing-identifying-growth-opportunities-in-the-stock-market","thumbnail":{"url":"https:\/\/stockmarketvidya.com\/blogs\/wp-content\/uploads\/2026\/03\/Sectoral-Investing.jpg","alt":"Sectoral Investing: Identifying Growth Opportunities in the Stock Market"},"title":"Sectoral Investing: Identifying Growth Opportunities in the Stock Market","author":{"name":"Share Market Blog","link":"https:\/\/stockmarketvidya.com\/blogs\/author\/share-market-blog\/"},"date":"Mar 21, 2026","dateGMT":"2026-03-21 06:10:47","modifiedDate":"2026-03-21 06:10:49","modifiedDateGMT":"2026-03-21 06:10:49","commentCount":"0","commentStatus":"open","categories":{"coma":"<a href=\"https:\/\/stockmarketvidya.com\/blogs\/category\/share-market\/\" rel=\"category tag\">Share Market<\/a>","space":"<a href=\"https:\/\/stockmarketvidya.com\/blogs\/category\/share-market\/\" rel=\"category tag\">Share Market<\/a>"},"taxonomies":{"post_tag":"<a href='https:\/\/stockmarketvidya.com\/blogs\/tag\/how-to-identify-strong-sectors\/' rel='post_tag'>how to identify strong sectors<\/a><a href='https:\/\/stockmarketvidya.com\/blogs\/tag\/option-trading-course-nagpur\/' rel='post_tag'>option trading course Nagpur<\/a><a href='https:\/\/stockmarketvidya.com\/blogs\/tag\/sector-rotation-strategy\/' rel='post_tag'>sector rotation strategy<\/a><a href='https:\/\/stockmarketvidya.com\/blogs\/tag\/sectoral-investing\/' rel='post_tag'>sectoral investing<\/a><a href='https:\/\/stockmarketvidya.com\/blogs\/tag\/share-market-classes-nagpur\/' rel='post_tag'>share market classes Nagpur<\/a><a href='https:\/\/stockmarketvidya.com\/blogs\/tag\/stock-market-course-nagpur\/' rel='post_tag'>Stock Market Course Nagpur<\/a><a href='https:\/\/stockmarketvidya.com\/blogs\/tag\/stock-market-sectors-india\/' rel='post_tag'>stock market sectors India<\/a><a href='https:\/\/stockmarketvidya.com\/blogs\/tag\/stock-market-training-nagpur\/' rel='post_tag'>stock market training Nagpur<\/a><a href='https:\/\/stockmarketvidya.com\/blogs\/tag\/technical-analysis-course-nagpur\/' rel='post_tag'>technical analysis course Nagpur<\/a>"},"readTime":{"min":9,"sec":26},"status":"publish","excerpt":""},{"id":776,"link":"https:\/\/stockmarketvidya.com\/blogs\/can-share-market-knowledge-help-students-in-future-careers-yes-heres-how\/","name":"can-share-market-knowledge-help-students-in-future-careers-yes-heres-how","thumbnail":{"url":"https:\/\/stockmarketvidya.com\/blogs\/wp-content\/uploads\/2026\/03\/Can-Share-Market-Knowledge-Help-Students-in-Future-Careers.jpg","alt":"Can Share Market Knowledge Help Students in Future Careers? Yes\u2014Here\u2019s How"},"title":"Can Share Market Knowledge Help Students in Future Careers? Yes\u2014Here\u2019s How","author":{"name":"Share Market Blog","link":"https:\/\/stockmarketvidya.com\/blogs\/author\/share-market-blog\/"},"date":"Mar 20, 2026","dateGMT":"2026-03-20 05:51:04","modifiedDate":"2026-03-20 06:13:46","modifiedDateGMT":"2026-03-20 06:13:46","commentCount":"0","commentStatus":"open","categories":{"coma":"<a href=\"https:\/\/stockmarketvidya.com\/blogs\/category\/share-market\/\" rel=\"category tag\">Share Market<\/a>","space":"<a href=\"https:\/\/stockmarketvidya.com\/blogs\/category\/share-market\/\" rel=\"category tag\">Share Market<\/a>"},"taxonomies":{"post_tag":"<a href='https:\/\/stockmarketvidya.com\/blogs\/tag\/best-trading-institute-in-nagpur\/' rel='post_tag'>best trading institute in Nagpur<\/a><a href='https:\/\/stockmarketvidya.com\/blogs\/tag\/intraday-trading-course-nagpur\/' rel='post_tag'>intraday trading course Nagpur<\/a><a href='https:\/\/stockmarketvidya.com\/blogs\/tag\/option-trading-course-nagpur\/' rel='post_tag'>option trading course Nagpur<\/a><a href='https:\/\/stockmarketvidya.com\/blogs\/tag\/share-market-course-in-nagpur\/' rel='post_tag'>Share Market Course in Nagpur<\/a><a href='https:\/\/stockmarketvidya.com\/blogs\/tag\/stock-market-classes-for-beginners\/' rel='post_tag'>stock market classes for beginners<\/a><a href='https:\/\/stockmarketvidya.com\/blogs\/tag\/stock-market-course-for-students\/' rel='post_tag'>stock market course for students<\/a><a href='https:\/\/stockmarketvidya.com\/blogs\/tag\/stock-market-training-nagpur\/' rel='post_tag'>stock market training Nagpur<\/a><a href='https:\/\/stockmarketvidya.com\/blogs\/tag\/technical-analysis-course-nagpur\/' rel='post_tag'>technical analysis course Nagpur<\/a>"},"readTime":{"min":9,"sec":12},"status":"publish","excerpt":""},{"id":769,"link":"https:\/\/stockmarketvidya.com\/blogs\/developing-a-winning-trading-mindset-the-secret-behind-successful-traders-in-the-stock-market\/","name":"developing-a-winning-trading-mindset-the-secret-behind-successful-traders-in-the-stock-market","thumbnail":{"url":"https:\/\/stockmarketvidya.com\/blogs\/wp-content\/uploads\/2026\/03\/Developing-a-Winning-Trading-Mindset-1.png","alt":"Developing a Winning Trading Mindset: The Secret Behind Successful Traders in the Stock Market"},"title":"Developing a Winning Trading Mindset: The Secret Behind Successful Traders in the Stock Market","author":{"name":"Share Market Blog","link":"https:\/\/stockmarketvidya.com\/blogs\/author\/share-market-blog\/"},"date":"Mar 14, 2026","dateGMT":"2026-03-14 01:00:00","modifiedDate":"2026-03-21 07:03:43","modifiedDateGMT":"2026-03-21 07:03:43","commentCount":"0","commentStatus":"open","categories":{"coma":"<a href=\"https:\/\/stockmarketvidya.com\/blogs\/category\/share-market\/\" rel=\"category tag\">Share Market<\/a>, <a href=\"https:\/\/stockmarketvidya.com\/blogs\/category\/share-market-course\/\" rel=\"category tag\">Share Market Course<\/a>","space":"<a href=\"https:\/\/stockmarketvidya.com\/blogs\/category\/share-market\/\" rel=\"category tag\">Share Market<\/a> <a href=\"https:\/\/stockmarketvidya.com\/blogs\/category\/share-market-course\/\" rel=\"category tag\">Share Market Course<\/a>"},"taxonomies":{"post_tag":"<a href='https:\/\/stockmarketvidya.com\/blogs\/tag\/emotional-trading-control\/' rel='post_tag'>emotional trading control<\/a><a href='https:\/\/stockmarketvidya.com\/blogs\/tag\/intraday-trading-mindset\/' rel='post_tag'>intraday trading mindset<\/a><a href='https:\/\/stockmarketvidya.com\/blogs\/tag\/learn-trading-in-nagpur\/' rel='post_tag'>Learn Trading in Nagpur<\/a><a href='https:\/\/stockmarketvidya.com\/blogs\/tag\/share-market-course-nagpur\/' rel='post_tag'>share market course Nagpur<\/a><a href='https:\/\/stockmarketvidya.com\/blogs\/tag\/stock-market-classes-nagpur\/' rel='post_tag'>Stock market classes Nagpur<\/a><a href='https:\/\/stockmarketvidya.com\/blogs\/tag\/stock-market-psychology\/' rel='post_tag'>stock market psychology<\/a><a href='https:\/\/stockmarketvidya.com\/blogs\/tag\/technical-analysis-course-nagpur\/' rel='post_tag'>technical analysis course Nagpur<\/a>"},"readTime":{"min":15,"sec":42},"status":"publish","excerpt":""},{"id":766,"link":"https:\/\/stockmarketvidya.com\/blogs\/how-dividends-work-earn-passive-income-from-shares-in-the-indian-stock-market\/","name":"how-dividends-work-earn-passive-income-from-shares-in-the-indian-stock-market","thumbnail":{"url":"https:\/\/stockmarketvidya.com\/blogs\/wp-content\/uploads\/2026\/03\/How-Dividends-Work.jpg","alt":"How Dividends Work: Earn Passive Income from Shares in the Indian Stock Market"},"title":"How Dividends Work: Earn Passive Income from Shares in the Indian Stock Market","author":{"name":"Share Market Blog","link":"https:\/\/stockmarketvidya.com\/blogs\/author\/share-market-blog\/"},"date":"Mar 13, 2026","dateGMT":"2026-03-13 07:12:26","modifiedDate":"2026-03-13 07:12:28","modifiedDateGMT":"2026-03-13 07:12:28","commentCount":"0","commentStatus":"open","categories":{"coma":"<a href=\"https:\/\/stockmarketvidya.com\/blogs\/category\/share-market\/\" rel=\"category tag\">Share Market<\/a>, <a href=\"https:\/\/stockmarketvidya.com\/blogs\/category\/share-market-course\/\" rel=\"category tag\">Share Market Course<\/a>","space":"<a href=\"https:\/\/stockmarketvidya.com\/blogs\/category\/share-market\/\" rel=\"category tag\">Share Market<\/a> <a href=\"https:\/\/stockmarketvidya.com\/blogs\/category\/share-market-course\/\" rel=\"category tag\">Share Market Course<\/a>"},"taxonomies":{"post_tag":"<a href='https:\/\/stockmarketvidya.com\/blogs\/tag\/dividend-investing\/' rel='post_tag'>dividend investing<\/a><a href='https:\/\/stockmarketvidya.com\/blogs\/tag\/dividend-stocks-india\/' rel='post_tag'>dividend stocks India<\/a><a href='https:\/\/stockmarketvidya.com\/blogs\/tag\/financial-investing-india\/' rel='post_tag'>financial investing India<\/a><a href='https:\/\/stockmarketvidya.com\/blogs\/tag\/long-term-investing-2\/' rel='post_tag'>long term investing<\/a><a href='https:\/\/stockmarketvidya.com\/blogs\/tag\/passive-income-from-shares\/' rel='post_tag'>passive income from shares<\/a><a href='https:\/\/stockmarketvidya.com\/blogs\/tag\/portfolio-income-investing\/' rel='post_tag'>portfolio income investing<\/a><a href='https:\/\/stockmarketvidya.com\/blogs\/tag\/stock-market-beginners\/' rel='post_tag'>stock market beginners<\/a><a href='https:\/\/stockmarketvidya.com\/blogs\/tag\/stock-market-education\/' rel='post_tag'>Stock market education<\/a><a href='https:\/\/stockmarketvidya.com\/blogs\/tag\/wealth-creation-through-stocks\/' rel='post_tag'>wealth creation through stocks<\/a>"},"readTime":{"min":15,"sec":46},"status":"publish","excerpt":""},{"id":758,"link":"https:\/\/stockmarketvidya.com\/blogs\/small-cap-vs-mid-cap-vs-large-cap-stocks-where-should-smart-investors-in-nagpur-invest\/","name":"small-cap-vs-mid-cap-vs-large-cap-stocks-where-should-smart-investors-in-nagpur-invest","thumbnail":{"url":"https:\/\/stockmarketvidya.com\/blogs\/wp-content\/uploads\/2026\/03\/Small-Cap-vs-Mid-Cap-vs-Large-Cap-Stocks.jpg","alt":"Small Cap vs Mid Cap vs Large Cap Stocks: Where Should Smart Investors in Nagpur Invest?"},"title":"Small Cap vs Mid Cap vs Large Cap Stocks: Where Should Smart Investors in Nagpur Invest?","author":{"name":"Share Market Blog","link":"https:\/\/stockmarketvidya.com\/blogs\/author\/share-market-blog\/"},"date":"Mar 6, 2026","dateGMT":"2026-03-06 01:00:00","modifiedDate":"2026-03-04 11:33:11","modifiedDateGMT":"2026-03-04 11:33:11","commentCount":"0","commentStatus":"open","categories":{"coma":"<a href=\"https:\/\/stockmarketvidya.com\/blogs\/category\/share-market\/\" rel=\"category tag\">Share Market<\/a>, <a href=\"https:\/\/stockmarketvidya.com\/blogs\/category\/share-market-course\/\" rel=\"category tag\">Share Market Course<\/a>","space":"<a href=\"https:\/\/stockmarketvidya.com\/blogs\/category\/share-market\/\" rel=\"category tag\">Share Market<\/a> <a href=\"https:\/\/stockmarketvidya.com\/blogs\/category\/share-market-course\/\" rel=\"category tag\">Share Market Course<\/a>"},"taxonomies":{"post_tag":"<a href='https:\/\/stockmarketvidya.com\/blogs\/tag\/difference-between-small-mid-large-cap\/' rel='post_tag'>difference between small mid large cap<\/a><a href='https:\/\/stockmarketvidya.com\/blogs\/tag\/equity-investment-guide\/' rel='post_tag'>equity investment guide<\/a><a href='https:\/\/stockmarketvidya.com\/blogs\/tag\/investment-strategy-india-portfolio-diversification\/' rel='post_tag'>investment strategy India portfolio diversification<\/a><a href='https:\/\/stockmarketvidya.com\/blogs\/tag\/market-capitalization-explained\/' rel='post_tag'>market capitalization explained<\/a><a href='https:\/\/stockmarketvidya.com\/blogs\/tag\/market-cycles-investing\/' rel='post_tag'>market cycles investing<\/a><a href='https:\/\/stockmarketvidya.com\/blogs\/tag\/nifty-midcap-150\/' rel='post_tag'>NIFTY Midcap 150<\/a><a href='https:\/\/stockmarketvidya.com\/blogs\/tag\/nifty-smallcap-250\/' rel='post_tag'>NIFTY Smallcap 250<\/a><a href='https:\/\/stockmarketvidya.com\/blogs\/tag\/risk-management-in-stock-market-long-term-investing-india\/' rel='post_tag'>risk management in stock market long term investing India<\/a><a href='https:\/\/stockmarketvidya.com\/blogs\/tag\/sebi-stock-classification\/' rel='post_tag'>SEBI stock classification<\/a><a href='https:\/\/stockmarketvidya.com\/blogs\/tag\/share-market-classes-nagpur\/' rel='post_tag'>share market classes Nagpur<\/a><a href='https:\/\/stockmarketvidya.com\/blogs\/tag\/share-trading-classes-nagpur\/' rel='post_tag'>Share Trading Classes Nagpur<\/a><a href='https:\/\/stockmarketvidya.com\/blogs\/tag\/stock-market-course-nagpur\/' rel='post_tag'>Stock Market Course Nagpur<\/a><a href='https:\/\/stockmarketvidya.com\/blogs\/tag\/stock-market-training-nagpur\/' rel='post_tag'>stock market training Nagpur<\/a><a href='https:\/\/stockmarketvidya.com\/blogs\/tag\/stock-market-vidya\/' rel='post_tag'>Stock Market Vidya<\/a>"},"readTime":{"min":9,"sec":59},"status":"publish","excerpt":""},{"id":760,"link":"https:\/\/stockmarketvidya.com\/blogs\/stock-exchanges-explained-in-simple-words-nse-vs-bse-which-one-matters-for-you-as-a-trader\/","name":"stock-exchanges-explained-in-simple-words-nse-vs-bse-which-one-matters-for-you-as-a-trader","thumbnail":{"url":"https:\/\/stockmarketvidya.com\/blogs\/wp-content\/uploads\/2026\/03\/NSE-vs-BSE.jpg","alt":"Stock Exchanges Explained in Simple Words: NSE vs BSE \u2013 Which One Matters for You as a Trader?"},"title":"Stock Exchanges Explained in Simple Words: NSE vs BSE \u2013 Which One Matters for You as a Trader?","author":{"name":"Share Market Blog","link":"https:\/\/stockmarketvidya.com\/blogs\/author\/share-market-blog\/"},"date":"Mar 4, 2026","dateGMT":"2026-03-04 10:54:30","modifiedDate":"2026-03-04 10:54:31","modifiedDateGMT":"2026-03-04 10:54:31","commentCount":"0","commentStatus":"open","categories":{"coma":"<a href=\"https:\/\/stockmarketvidya.com\/blogs\/category\/share-market\/\" rel=\"category tag\">Share Market<\/a>, <a href=\"https:\/\/stockmarketvidya.com\/blogs\/category\/share-market-course\/\" rel=\"category tag\">Share Market Course<\/a>","space":"<a href=\"https:\/\/stockmarketvidya.com\/blogs\/category\/share-market\/\" rel=\"category tag\">Share Market<\/a> <a href=\"https:\/\/stockmarketvidya.com\/blogs\/category\/share-market-course\/\" rel=\"category tag\">Share Market Course<\/a>"},"taxonomies":{"post_tag":"<a href='https:\/\/stockmarketvidya.com\/blogs\/tag\/equity-market-india\/' rel='post_tag'>equity market India<\/a><a href='https:\/\/stockmarketvidya.com\/blogs\/tag\/futures-and-options-nse\/' rel='post_tag'>Futures and Options NSE<\/a><a href='https:\/\/stockmarketvidya.com\/blogs\/tag\/market-depth-analysis\/' rel='post_tag'>market depth analysis<\/a><a href='https:\/\/stockmarketvidya.com\/blogs\/tag\/order-matching-system\/' rel='post_tag'>order matching system<\/a><a href='https:\/\/stockmarketvidya.com\/blogs\/tag\/share-market-course-nagpur\/' rel='post_tag'>share market course Nagpur<\/a><a href='https:\/\/stockmarketvidya.com\/blogs\/tag\/share-trading-classes-nagpur\/' rel='post_tag'>Share Trading Classes Nagpur<\/a><a href='https:\/\/stockmarketvidya.com\/blogs\/tag\/stock-market-basics\/' rel='post_tag'>stock market basics<\/a><a href='https:\/\/stockmarketvidya.com\/blogs\/tag\/stock-market-for-beginners\/' rel='post_tag'>Stock market for beginners<\/a><a href='https:\/\/stockmarketvidya.com\/blogs\/tag\/stock-market-training-nagpur\/' rel='post_tag'>stock market training Nagpur<\/a><a href='https:\/\/stockmarketvidya.com\/blogs\/tag\/stock-market-vidya-nagpur\/' rel='post_tag'>Stock Market Vidya Nagpur<\/a><a href='https:\/\/stockmarketvidya.com\/blogs\/tag\/t1-settlement-cycle\/' rel='post_tag'>T+1 settlement cycle<\/a><a href='https:\/\/stockmarketvidya.com\/blogs\/tag\/trading-education-india\/' rel='post_tag'>trading education india<\/a>"},"readTime":{"min":11,"sec":24},"status":"publish","excerpt":""},{"id":744,"link":"https:\/\/stockmarketvidya.com\/blogs\/etf-is-the-smartest-investment-choice-today-a-practical-guide-for-modern-investors\/","name":"etf-is-the-smartest-investment-choice-today-a-practical-guide-for-modern-investors","thumbnail":{"url":"https:\/\/stockmarketvidya.com\/blogs\/wp-content\/uploads\/2026\/02\/ETF-Is-the-Smartest-Investment-Choice-Today-2.jpg","alt":""},"title":"ETF Is the Smartest Investment Choice Today \u2013 A Practical Guide for Modern Investors","author":{"name":"Share Market Blog","link":"https:\/\/stockmarketvidya.com\/blogs\/author\/share-market-blog\/"},"date":"Feb 26, 2026","dateGMT":"2026-02-26 12:29:32","modifiedDate":"2026-02-26 12:30:23","modifiedDateGMT":"2026-02-26 12:30:23","commentCount":"0","commentStatus":"open","categories":{"coma":"<a href=\"https:\/\/stockmarketvidya.com\/blogs\/category\/share-market\/\" rel=\"category tag\">Share Market<\/a>","space":"<a href=\"https:\/\/stockmarketvidya.com\/blogs\/category\/share-market\/\" rel=\"category tag\">Share Market<\/a>"},"taxonomies":{"post_tag":""},"readTime":{"min":10,"sec":51},"status":"publish","excerpt":""},{"id":739,"link":"https:\/\/stockmarketvidya.com\/blogs\/short-strangle-strategy-in-a-sideways-market\/","name":"short-strangle-strategy-in-a-sideways-market","thumbnail":{"url":"https:\/\/stockmarketvidya.com\/blogs\/wp-content\/uploads\/2026\/02\/Short-Strangle-Strategy-in-a-marketing-Experts.png","alt":"Short Strangle Strategy in a Sideways Market"},"title":"Short Strangle Strategy in a Sideways Market","author":{"name":"Share Market Blog","link":"https:\/\/stockmarketvidya.com\/blogs\/author\/share-market-blog\/"},"date":"Feb 22, 2026","dateGMT":"2026-02-22 01:00:00","modifiedDate":"2026-02-20 07:38:34","modifiedDateGMT":"2026-02-20 07:38:34","commentCount":"0","commentStatus":"open","categories":{"coma":"<a href=\"https:\/\/stockmarketvidya.com\/blogs\/category\/share-market\/\" rel=\"category tag\">Share Market<\/a>, <a href=\"https:\/\/stockmarketvidya.com\/blogs\/category\/share-market-course\/\" rel=\"category tag\">Share Market Course<\/a>","space":"<a href=\"https:\/\/stockmarketvidya.com\/blogs\/category\/share-market\/\" rel=\"category tag\">Share Market<\/a> <a href=\"https:\/\/stockmarketvidya.com\/blogs\/category\/share-market-course\/\" rel=\"category tag\">Share Market Course<\/a>"},"taxonomies":{"post_tag":""},"readTime":{"min":9,"sec":24},"status":"publish","excerpt":""},{"id":734,"link":"https:\/\/stockmarketvidya.com\/blogs\/buy-strangle-strategy-in-a-volatile-market-how-smart-traders-profit-from-big-price-moves\/","name":"buy-strangle-strategy-in-a-volatile-market-how-smart-traders-profit-from-big-price-moves","thumbnail":{"url":"https:\/\/stockmarketvidya.com\/blogs\/wp-content\/uploads\/2026\/02\/Buy-Strangle-Strategy-in-a-Volatile-Market.jpg","alt":"Buy Strangle Strategy in a Volatile Market: How Smart Traders Profit from Big Price Moves"},"title":"Buy Strangle Strategy in a Volatile Market: How Smart Traders Profit from Big Price Moves","author":{"name":"Share Market Blog","link":"https:\/\/stockmarketvidya.com\/blogs\/author\/share-market-blog\/"},"date":"Feb 20, 2026","dateGMT":"2026-02-20 06:36:50","modifiedDate":"2026-02-20 06:36:52","modifiedDateGMT":"2026-02-20 06:36:52","commentCount":"0","commentStatus":"open","categories":{"coma":"<a href=\"https:\/\/stockmarketvidya.com\/blogs\/category\/share-market\/\" rel=\"category tag\">Share Market<\/a>, <a href=\"https:\/\/stockmarketvidya.com\/blogs\/category\/share-market-course\/\" rel=\"category tag\">Share Market Course<\/a>","space":"<a href=\"https:\/\/stockmarketvidya.com\/blogs\/category\/share-market\/\" rel=\"category tag\">Share Market<\/a> <a href=\"https:\/\/stockmarketvidya.com\/blogs\/category\/share-market-course\/\" rel=\"category tag\">Share Market Course<\/a>"},"taxonomies":{"post_tag":""},"readTime":{"min":8,"sec":20},"status":"publish","excerpt":""},{"id":727,"link":"https:\/\/stockmarketvidya.com\/blogs\/short-straddle-in-sideways-market-a-complete-traders-perspective\/","name":"short-straddle-in-sideways-market-a-complete-traders-perspective","thumbnail":{"url":"https:\/\/stockmarketvidya.com\/blogs\/wp-content\/uploads\/2026\/02\/Short-Straddle-in-Sideways-Market.jpg","alt":"Short Straddle in Sideways Market: A Complete Trader\u2019s Perspective"},"title":"Short Straddle in Sideways Market: A Complete Trader\u2019s Perspective","author":{"name":"Share Market Blog","link":"https:\/\/stockmarketvidya.com\/blogs\/author\/share-market-blog\/"},"date":"Feb 13, 2026","dateGMT":"2026-02-13 01:55:00","modifiedDate":"2026-02-11 06:28:05","modifiedDateGMT":"2026-02-11 06:28:05","commentCount":"0","commentStatus":"open","categories":{"coma":"<a href=\"https:\/\/stockmarketvidya.com\/blogs\/category\/share-market\/\" rel=\"category tag\">Share Market<\/a>","space":"<a href=\"https:\/\/stockmarketvidya.com\/blogs\/category\/share-market\/\" rel=\"category tag\">Share Market<\/a>"},"taxonomies":{"post_tag":"<a href='https:\/\/stockmarketvidya.com\/blogs\/tag\/bank-nifty-option-selling-strategy\/' rel='post_tag'>BANK NIFTY option selling strategy<\/a><a href='https:\/\/stockmarketvidya.com\/blogs\/tag\/best-share-market-classes-in-nagpur\/' rel='post_tag'>Best share market classes in Nagpur<\/a><a href='https:\/\/stockmarketvidya.com\/blogs\/tag\/expiry-day-trading-strategy\/' rel='post_tag'>expiry day trading strategy<\/a><a href='https:\/\/stockmarketvidya.com\/blogs\/tag\/nifty-short-straddle\/' rel='post_tag'>NIFTY Short Straddle<\/a><a href='https:\/\/stockmarketvidya.com\/blogs\/tag\/nism-certified-trainer-nagpur\/' rel='post_tag'>NISM Certified Trainer Nagpur<\/a><a href='https:\/\/stockmarketvidya.com\/blogs\/tag\/non-directional-options-strategy\/' rel='post_tag'>Non Directional Options Strategy<\/a><a href='https:\/\/stockmarketvidya.com\/blogs\/tag\/option-selling-course-nagpur\/' rel='post_tag'>option selling course Nagpur<\/a><a href='https:\/\/stockmarketvidya.com\/blogs\/tag\/option-selling-strategy\/' rel='post_tag'>option selling strategy<\/a><a href='https:\/\/stockmarketvidya.com\/blogs\/tag\/options-trading-for-beginners\/' rel='post_tag'>Options trading for beginners<\/a><a href='https:\/\/stockmarketvidya.com\/blogs\/tag\/premium-decay-strategy\/' rel='post_tag'>premium decay strategy<\/a><a href='https:\/\/stockmarketvidya.com\/blogs\/tag\/professional-stock-market-training\/' rel='post_tag'>professional stock market training<\/a><a href='https:\/\/stockmarketvidya.com\/blogs\/tag\/range-bound-market-strategy\/' rel='post_tag'>range bound market strategy<\/a><a href='https:\/\/stockmarketvidya.com\/blogs\/tag\/share-market-classes-in-nagpur\/' rel='post_tag'>Share Market Classes in Nagpur<\/a><a href='https:\/\/stockmarketvidya.com\/blogs\/tag\/share-market-training-in-nagpur\/' rel='post_tag'>share market training in Nagpur<\/a><a href='https:\/\/stockmarketvidya.com\/blogs\/tag\/short-straddle-in-sideways-market\/' rel='post_tag'>Short Straddle in sideways market<\/a><a href='https:\/\/stockmarketvidya.com\/blogs\/tag\/short-straddle-strategy\/' rel='post_tag'>Short Straddle strategy<\/a><a href='https:\/\/stockmarketvidya.com\/blogs\/tag\/sideways-market-trading-strategy\/' rel='post_tag'>sideways market trading strategy<\/a><a href='https:\/\/stockmarketvidya.com\/blogs\/tag\/stock-market-course-near-me\/' rel='post_tag'>stock market course near me<\/a><a href='https:\/\/stockmarketvidya.com\/blogs\/tag\/stock-market-vidya-nagpur\/' rel='post_tag'>Stock Market Vidya Nagpur<\/a><a href='https:\/\/stockmarketvidya.com\/blogs\/tag\/time-decay-trading-strategy\/' rel='post_tag'>time decay trading strategy<\/a><a href='https:\/\/stockmarketvidya.com\/blogs\/tag\/volatility-based-option-selling\/' rel='post_tag'>volatility based option selling<\/a>"},"readTime":{"min":8,"sec":31},"status":"publish","excerpt":""},{"id":720,"link":"https:\/\/stockmarketvidya.com\/blogs\/buy-straddle-strategy-in-a-volatile-market-how-smart-traders-trade-big-moves-without-predicting-direction\/","name":"buy-straddle-strategy-in-a-volatile-market-how-smart-traders-trade-big-moves-without-predicting-direction","thumbnail":{"url":"https:\/\/stockmarketvidya.com\/blogs\/wp-content\/uploads\/2026\/02\/Buy-Straddle-Strategy-in-a-Volatile-Market.jpg","alt":"Buy Straddle Strategy in a Volatile Market: How Smart Traders Trade Big Moves Without Predicting Direction"},"title":"Buy Straddle Strategy in a Volatile Market: How Smart Traders Trade Big Moves Without Predicting Direction","author":{"name":"Share Market Blog","link":"https:\/\/stockmarketvidya.com\/blogs\/author\/share-market-blog\/"},"date":"Feb 11, 2026","dateGMT":"2026-02-11 05:52:31","modifiedDate":"2026-02-11 06:39:48","modifiedDateGMT":"2026-02-11 06:39:48","commentCount":"1","commentStatus":"open","categories":{"coma":"<a href=\"https:\/\/stockmarketvidya.com\/blogs\/category\/share-market\/\" rel=\"category tag\">Share Market<\/a>","space":"<a href=\"https:\/\/stockmarketvidya.com\/blogs\/category\/share-market\/\" rel=\"category tag\">Share Market<\/a>"},"taxonomies":{"post_tag":"<a href='https:\/\/stockmarketvidya.com\/blogs\/tag\/banknifty-straddle-strategy\/' rel='post_tag'>BANKNIFTY straddle strategy<\/a><a href='https:\/\/stockmarketvidya.com\/blogs\/tag\/best-share-market-classes-in-nagpur\/' rel='post_tag'>Best share market classes in Nagpur<\/a><a href='https:\/\/stockmarketvidya.com\/blogs\/tag\/buy-straddle-in-volatile-market\/' rel='post_tag'>Buy Straddle in volatile market<\/a><a href='https:\/\/stockmarketvidya.com\/blogs\/tag\/buy-straddle-strategy\/' rel='post_tag'>Buy Straddle strategy<\/a><a href='https:\/\/stockmarketvidya.com\/blogs\/tag\/direction-neutral-trading-strategy\/' rel='post_tag'>direction neutral trading strategy<\/a><a href='https:\/\/stockmarketvidya.com\/blogs\/tag\/event-based-trading\/' rel='post_tag'>event based trading<\/a><a href='https:\/\/stockmarketvidya.com\/blogs\/tag\/how-to-trade-straddle\/' rel='post_tag'>how to trade straddle<\/a><a href='https:\/\/stockmarketvidya.com\/blogs\/tag\/intraday-options-strategy\/' rel='post_tag'>intraday options strategy<\/a><a href='https:\/\/stockmarketvidya.com\/blogs\/tag\/nifty-options-strategy\/' rel='post_tag'>Nifty Options Strategy<\/a><a href='https:\/\/stockmarketvidya.com\/blogs\/tag\/nism-certified-trainer-nagpur\/' rel='post_tag'>NISM Certified Trainer Nagpur<\/a><a href='https:\/\/stockmarketvidya.com\/blogs\/tag\/options-trading-course-nagpur\/' rel='post_tag'>options trading course Nagpur<\/a><a href='https:\/\/stockmarketvidya.com\/blogs\/tag\/options-trading-for-beginners\/' rel='post_tag'>Options trading for beginners<\/a><a href='https:\/\/stockmarketvidya.com\/blogs\/tag\/options-trading-strategy\/' rel='post_tag'>Options trading strategy<\/a><a href='https:\/\/stockmarketvidya.com\/blogs\/tag\/risk-management-in-options-trading\/' rel='post_tag'>risk management in options trading<\/a><a href='https:\/\/stockmarketvidya.com\/blogs\/tag\/share-market-classes-in-nagpur\/' rel='post_tag'>Share Market Classes in Nagpur<\/a><a href='https:\/\/stockmarketvidya.com\/blogs\/tag\/share-market-training-in-nagpur\/' rel='post_tag'>share market training in Nagpur<\/a><a href='https:\/\/stockmarketvidya.com\/blogs\/tag\/stock-market-course-near-me\/' rel='post_tag'>stock market course near me<\/a><a href='https:\/\/stockmarketvidya.com\/blogs\/tag\/stock-market-vidya-nagpur\/' rel='post_tag'>Stock Market Vidya Nagpur<\/a><a href='https:\/\/stockmarketvidya.com\/blogs\/tag\/volatility-based-trading\/' rel='post_tag'>volatility based trading<\/a><a href='https:\/\/stockmarketvidya.com\/blogs\/tag\/volatility-trading-strategy\/' rel='post_tag'>volatility trading strategy<\/a>"},"readTime":{"min":8,"sec":47},"status":"publish","excerpt":""}]