Presented by Stock Market Vidya, Share Market Training Institute, Nagpur | Guided by Mr. Prashant Sarode
Introduction: The Hidden Language of Charts
When you look at a stock chart, you’re not just seeing price movement — you’re witnessing a silent conversation between buyers and sellers. Every wave, every spike, every dip tells a story. This story is what traders decode using price patterns.
If you’ve ever asked, “How do successful traders predict the next move?” — the answer often lies in understanding these price formations.
Whether you’re a beginner enrolling in a stock market course or someone exploring advanced share market classes, decoding price patterns is a skill that can change the way you see the market. And at Stock Market Vidya Nagpur, you get a chance to explore these insights deeply, under the mentorship of Mr. Prashant Sarode, through some of the best share market classes in Nagpur.
What Are Price Patterns?
Price patterns are recognizable shapes formed by the movement of stock prices over time. They reflect trader psychology, market sentiment, and potential direction — either continuation or reversal.
Price patterns aren’t predictions, but they are strong indications. Like traffic signals, they don’t control the market — but they often suggest what’s likely to happen next.
They help traders:
Spot potential breakout points
Understand support and resistance levels
Manage entries and exits with better timing
Whether you’re enrolled in a share market course near me or learning independently, price patterns are a core building block of stock market training.
Why Traders Swear by Price Patterns
Imagine playing chess without recognizing standard strategies. You’d be lost.
Similarly, entering the market without learning price patterns is like trading blindfolded.
Here’s why mastering price patterns is crucial:
They provide structure: Markets may look chaotic, but patterns offer order.
They save time: Instead of analyzing every tick, traders wait for specific patterns to appear.
They help manage risk: Patterns often come with clear stop-loss and target levels.
At Stock Market Vidya, students learn how to analyze these patterns on real charts. That’s why it’s known as the best share market classes in Nagpur.
Classification of Price Patterns: Continuation vs. Reversal
There are two broad categories of price patterns every trader must understand:
1. Continuation Patterns
These suggest that the trend will continue in the same direction.
Examples include:
Flags and Pennants: After a sharp move, price consolidates in a tight range before continuing.
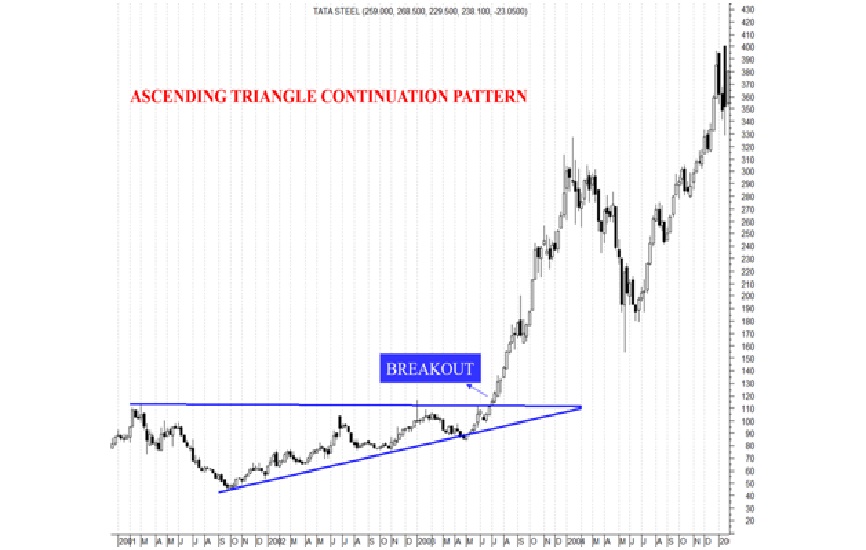
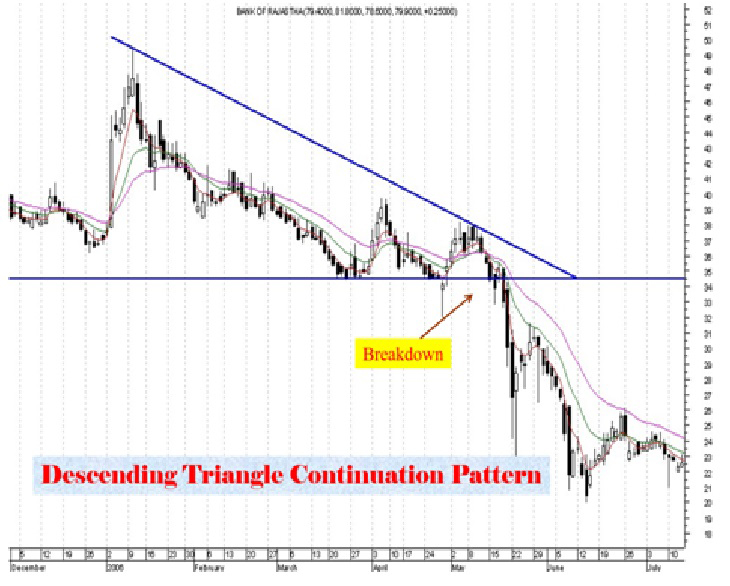
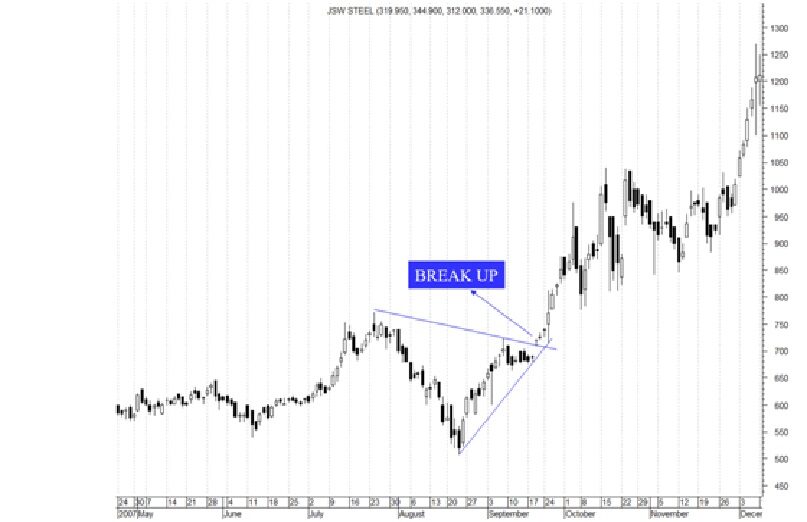
Triangles: Symmetrical, ascending, or descending triangles indicate a breakout is coming.
Rectangles: Price bounces between two levels before breaking out in the same direction.
These patterns are particularly useful during strong market trends. When combined with stock market training, they become powerful tools for trend trading.
2. Reversal Patterns
These indicate a potential change in the current trend.
Examples include:
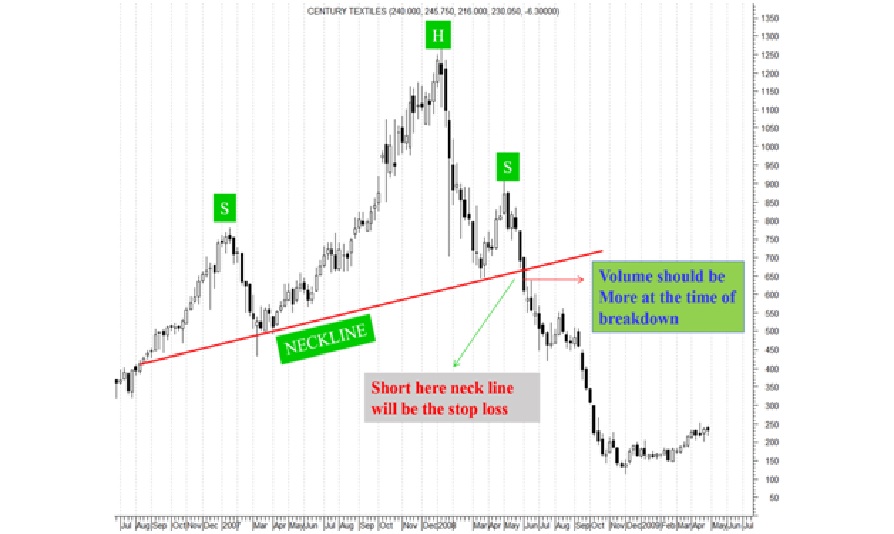
Head and Shoulders: A classic reversal sign in both uptrends and downtrends.
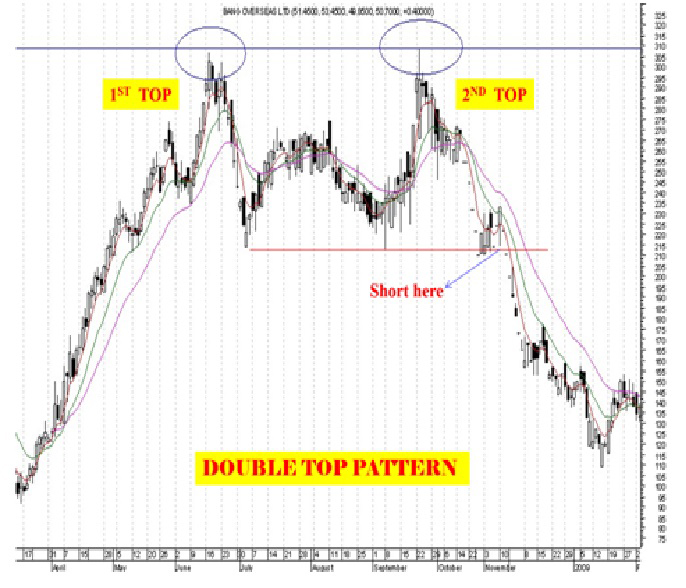
Double Top and Double Bottom: These look like “M” or “W” on charts and suggest significant turning points.
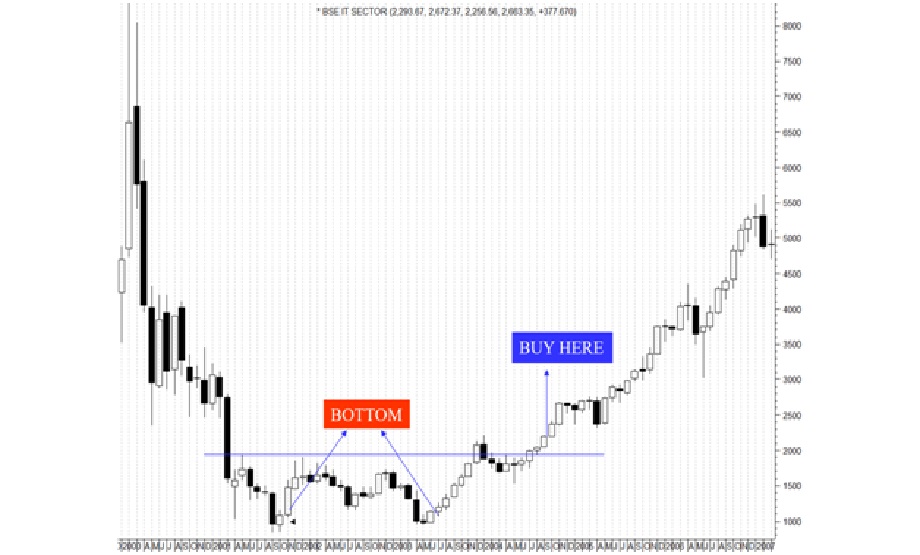
Rounding Bottoms: Indicate a slow and steady change in market direction, usually bullish.
Understanding these patterns in real-time takes practice — something you experience deeply in a well-structured share market course in Nagpur.
Zooming into Popular Price Patterns
Let’s break down some of the most impactful price patterns, what they mean, and how they help traders.
These formations reveal where the market has exhausted its current direction and is preparing to turn.
A quality stock market training program should equip you to act confidently when you see such setups.
How to Use Price Patterns in Real-World Trading
Price patterns alone aren’t magic. They work best when combined with:
Volume analysis
Support and resistance zones
Timeframe confirmation
Candlestick formations
At Stock Market Vidya, we focus on pattern confirmation. Every chart tells a story, and our students learn how to interpret that story with skill and confidence.
When these concepts are taught in a share market course using real-time examples and guided chart reading, students develop practical analysis skills — not just textbook knowledge.
Mindset Matters: The Discipline Behind the Pattern
Here’s the truth: most traders fail not because they don’t recognize patterns — but because they lack the patience to wait or the discipline to act.
Patterns take time to form. Markets test your emotions. That’s why our share market classes in Nagpur go beyond technical — focusing also on trader psychology, patience, and discipline.
Being able to act without emotion and execute the strategy as per the pattern is a critical part of your stock market training journey.
Combining Price Patterns with Technical Indicators
While price patterns are visual, combining them with tools like:
RSI (Relative Strength Index)
MACD (Moving Average Convergence Divergence)
Moving Averages
…can enhance your accuracy.
These are covered extensively in the share market course in Nagpur offered at Stock Market Vidya. Every class takes you closer to becoming a confident chart reader.
Real Case: How a Student Used a Triangle Pattern for a Winning Trade
One of our students identified a symmetrical triangle in a trending stock. After days of consolidation, the price broke out with volume. He entered at the breakout and exited with a solid 10% gain in three sessions.
This isn’t luck — it’s learning, practicing, and applying the knowledge. This is the core philosophy of our stock market course.
If you’re searching for a share market course near me, let your journey start where real strategies meet real mentorship — right here in Nagpur.
Conclusion: Price Patterns Are a Trader’s Compass
Markets don’t speak with words — they speak with patterns.
Whether you’re navigating sideways markets or hunting for breakout opportunities, price patterns are your compass. They don’t predict the future with certainty, but they prepare you for what’s likely.
At Stock Market Vidya, our mission is to equip you with that preparedness — through one of the best share market classes in Nagpur. Under the guidance of Mr. Prashant Sarode, you’ll move beyond guesswork and into strategic trading.
Enroll in our stock market training today and begin your journey to decoding charts like a pro.
FAQs on Price Patterns – Stock Market Vidya, Nagpur
Q1. What are price patterns in stock market trading? Ans: Price patterns are specific shapes formed by stock price movements on a chart. These shapes, such as triangles, head and shoulders, or flags, help traders predict the potential direction of price based on past behavior. They are widely used by technical analysts and are an essential part of every quality stock market training program.
Q2. Why are price patterns important in technical analysis? Ans: Price patterns provide visual signals of market sentiment. They allow traders to understand whether a trend is likely to continue or reverse. Learning to identify these formations helps traders make informed entry and exit decisions. At Stock Market Vidya Nagpur, students learn to recognize these patterns on real charts.
Q3. Are price patterns suitable for beginners? Ans: Yes, absolutely. Beginners who are enrolled in a share market course in Nagpur or searching for a share market course near me will find price patterns as one of the most practical and easy-to-understand tools in technical analysis. They form the foundation for strategic decision-making in trading.
Q4. How reliable are price patterns in predicting stock movements? Ans: While price patterns are not 100% accurate, they are highly effective when used with volume analysis and confirmation indicators. Their reliability increases when taught correctly under expert mentorship, like the guidance provided in our stock market course at Stock Market Vidya.
Q5. What is the difference between reversal and continuation patterns? Ans:
Reversal patterns signal a potential change in trend direction (e.g., Head & Shoulders, Double Top/Bottom).
Continuation patterns suggest that the current trend will likely continue (e.g., Triangles, Flags, Pennants). Understanding this difference is key to strategy building, and it’s covered in detail in our share market classes.
Q6. Can I apply price pattern analysis to intraday trading? Ans: Yes, price patterns are widely used in intraday trading. Short-term traders look for quick formations like flags and triangles on 5-minute or 15-minute charts. Students at Stock Market Vidya Nagpur are trained to identify patterns across various timeframes for both intraday and positional trading.
Q7. Which price pattern is the most powerful for traders? Ans: Patterns like Head and Shoulders, Double Bottoms, and Symmetrical Triangles are considered powerful due to their clear structure and high probability outcomes. However, the effectiveness of a pattern depends on how well it is recognized and confirmed — something taught practically in our stock market training sessions.
Q8. How do I know when a price pattern is valid? Ans: A valid pattern typically completes with a breakout, confirmed by increased volume and movement beyond support or resistance levels. Our share market course in Nagpur emphasizes volume confirmation and teaches methods to validate patterns before taking a trade.
Q9. Do price patterns work in all markets? Ans: Yes, price patterns work across all markets — equity, commodities, forex, and even cryptocurrencies. Since patterns are based on crowd psychology, they are universal in application. The stock market training at Stock Market Vidya includes multi-market examples to help students build flexibility.
Q10. What will I learn about price patterns in Stock Market Vidya’s classes? Ans: At Stock Market Vidya, the best share market classes in Nagpur, you’ll learn:
How to identify and interpret major price patterns
Entry and exit strategies using these patterns
Real-time analysis on live charts
Risk management and confirmation tools
How to combine patterns with technical indicators for better accuracy
With expert guidance from Mr. Prashant Sarode, students gain hands-on experience that goes beyond theoretical knowledge.
Q11. Can I learn price pattern strategies online from Stock Market Vidya? Ans: Yes, Stock Market Vidya offers structured learning both online and offline. Whether you’re searching for a share market course near me or prefer virtual training, you’ll receive comprehensive education in price action and chart reading techniques.
Q12. How long does it take to master price patterns? Ans: While you can start recognizing basic patterns within weeks, mastering them with confidence takes practice. With the focused stock market training at Stock Market Vidya, many students start trading with pattern-based strategies within 2–3 months of learning.
[{"id":987,"link":"https:\/\/stockmarketvidya.com\/blogs\/us-iran-tensions-ease-a-new-opportunity-for-stock-market-investment\/","name":"us-iran-tensions-ease-a-new-opportunity-for-stock-market-investment","thumbnail":{"url":"https:\/\/stockmarketvidya.com\/blogs\/wp-content\/uploads\/2026\/06\/US-Iran-Tensions-Ease-A-New-Opportunity-for-Stock-Market-Investment.png","alt":"US-Iran Tensions Ease A New Opportunity for Stock Market Investment"},"title":"US-Iran Tensions Ease: A New Opportunity for Stock Market Investment?","author":{"name":"Share Market Blog","link":"https:\/\/stockmarketvidya.com\/blogs\/author\/share-market-blog\/"},"date":"Jun 20, 2026","dateGMT":"2026-06-20 10:00:00","modifiedDate":"2026-06-23 07:29:25","modifiedDateGMT":"2026-06-23 07:29:25","commentCount":"0","commentStatus":"open","categories":{"coma":"<a href=\"https:\/\/stockmarketvidya.com\/blogs\/category\/share-market\/\" rel=\"category tag\">Share Market<\/a>, <a href=\"https:\/\/stockmarketvidya.com\/blogs\/category\/share-market-course\/\" rel=\"category tag\">Share Market Course<\/a>","space":"<a href=\"https:\/\/stockmarketvidya.com\/blogs\/category\/share-market\/\" rel=\"category tag\">Share Market<\/a> <a href=\"https:\/\/stockmarketvidya.com\/blogs\/category\/share-market-course\/\" rel=\"category tag\">Share Market Course<\/a>"},"taxonomies":{"post_tag":"<a href='https:\/\/stockmarketvidya.com\/blogs\/tag\/crude-oil-prices\/' rel='post_tag'>crude oil prices<\/a><a href='https:\/\/stockmarketvidya.com\/blogs\/tag\/foreign-institutional-investors\/' rel='post_tag'>foreign institutional investors<\/a><a href='https:\/\/stockmarketvidya.com\/blogs\/tag\/futures-and-options-training-nagpur\/' rel='post_tag'>futures and options training Nagpur<\/a><a href='https:\/\/stockmarketvidya.com\/blogs\/tag\/indian-stock-market\/' rel='post_tag'>Indian stock market<\/a><a href='https:\/\/stockmarketvidya.com\/blogs\/tag\/investing-for-beginners\/' rel='post_tag'>investing for beginners<\/a><a href='https:\/\/stockmarketvidya.com\/blogs\/tag\/market-psychology\/' rel='post_tag'>Market Psychology<\/a><a href='https:\/\/stockmarketvidya.com\/blogs\/tag\/option-trading-course-nagpur\/' rel='post_tag'>option trading course Nagpur<\/a><a href='https:\/\/stockmarketvidya.com\/blogs\/tag\/risk-management\/' rel='post_tag'>Risk Management<\/a><a href='https:\/\/stockmarketvidya.com\/blogs\/tag\/share-market-classes-nagpur\/' rel='post_tag'>share market classes Nagpur<\/a><a href='https:\/\/stockmarketvidya.com\/blogs\/tag\/share-market-course-nagpur\/' rel='post_tag'>share market course Nagpur<\/a><a href='https:\/\/stockmarketvidya.com\/blogs\/tag\/stock-market-education\/' rel='post_tag'>Stock market education<\/a><a href='https:\/\/stockmarketvidya.com\/blogs\/tag\/stock-market-investing\/' rel='post_tag'>stock market investing<\/a><a href='https:\/\/stockmarketvidya.com\/blogs\/tag\/stock-market-learning-institute-nagpur\/' rel='post_tag'>stock market learning institute Nagpur<\/a><a href='https:\/\/stockmarketvidya.com\/blogs\/tag\/stock-market-training-nagpur\/' rel='post_tag'>stock market training Nagpur<\/a><a href='https:\/\/stockmarketvidya.com\/blogs\/tag\/technical-analysis\/' rel='post_tag'>Technical Analysis<\/a><a href='https:\/\/stockmarketvidya.com\/blogs\/tag\/technical-analysis-course-nagpur\/' rel='post_tag'>technical analysis course Nagpur<\/a><a href='https:\/\/stockmarketvidya.com\/blogs\/tag\/trading-classes-nagpur\/' rel='post_tag'>trading classes Nagpur<\/a><a href='https:\/\/stockmarketvidya.com\/blogs\/tag\/trading-psychology\/' rel='post_tag'>Trading Psychology<\/a><a href='https:\/\/stockmarketvidya.com\/blogs\/tag\/us-iran-tensions\/' rel='post_tag'>US-Iran tensions<\/a>"},"readTime":{"min":11,"sec":44},"status":"publish","excerpt":""},{"id":981,"link":"https:\/\/stockmarketvidya.com\/blogs\/why-students-must-understand-the-stock-market-before-investing-their-first-rupee\/","name":"why-students-must-understand-the-stock-market-before-investing-their-first-rupee","thumbnail":{"url":"https:\/\/stockmarketvidya.com\/blogs\/wp-content\/uploads\/2026\/06\/Why-Students-Must-Understand-the-Stock-Market-Before-Investing-Their-First-Rupee.png","alt":"Why Students Must Understand the Stock Market Before Investing Their First Rupee"},"title":"Why Students Must Understand the Stock Market Before Investing Their First Rupee","author":{"name":"Share Market Blog","link":"https:\/\/stockmarketvidya.com\/blogs\/author\/share-market-blog\/"},"date":"Jun 18, 2026","dateGMT":"2026-06-18 06:55:50","modifiedDate":"2026-06-18 06:55:52","modifiedDateGMT":"2026-06-18 06:55:52","commentCount":"0","commentStatus":"open","categories":{"coma":"<a href=\"https:\/\/stockmarketvidya.com\/blogs\/category\/share-market\/\" rel=\"category tag\">Share Market<\/a>, <a href=\"https:\/\/stockmarketvidya.com\/blogs\/category\/share-market-course\/\" rel=\"category tag\">Share Market Course<\/a>","space":"<a href=\"https:\/\/stockmarketvidya.com\/blogs\/category\/share-market\/\" rel=\"category tag\">Share Market<\/a> <a href=\"https:\/\/stockmarketvidya.com\/blogs\/category\/share-market-course\/\" rel=\"category tag\">Share Market Course<\/a>"},"taxonomies":{"post_tag":"<a href='https:\/\/stockmarketvidya.com\/blogs\/tag\/financial-education-for-students\/' rel='post_tag'>financial education for students<\/a><a href='https:\/\/stockmarketvidya.com\/blogs\/tag\/financial-literacy\/' rel='post_tag'>financial literacy<\/a><a href='https:\/\/stockmarketvidya.com\/blogs\/tag\/futures-and-options-training-nagpur\/' rel='post_tag'>futures and options training Nagpur<\/a><a href='https:\/\/stockmarketvidya.com\/blogs\/tag\/investing-for-beginners\/' rel='post_tag'>investing for beginners<\/a><a href='https:\/\/stockmarketvidya.com\/blogs\/tag\/long-term-investing-2\/' rel='post_tag'>long term investing<\/a><a href='https:\/\/stockmarketvidya.com\/blogs\/tag\/option-trading-course-nagpur\/' rel='post_tag'>option trading course Nagpur<\/a><a href='https:\/\/stockmarketvidya.com\/blogs\/tag\/risk-management\/' rel='post_tag'>Risk Management<\/a><a href='https:\/\/stockmarketvidya.com\/blogs\/tag\/share-market-classes-nagpur\/' rel='post_tag'>share market classes Nagpur<\/a><a href='https:\/\/stockmarketvidya.com\/blogs\/tag\/share-market-course-nagpur\/' rel='post_tag'>share market course Nagpur<\/a><a href='https:\/\/stockmarketvidya.com\/blogs\/tag\/share-trading-course-nagpur\/' rel='post_tag'>share trading course Nagpur<\/a><a href='https:\/\/stockmarketvidya.com\/blogs\/tag\/stock-market-education\/' rel='post_tag'>Stock market education<\/a><a href='https:\/\/stockmarketvidya.com\/blogs\/tag\/stock-market-for-students\/' rel='post_tag'>stock market for students<\/a><a href='https:\/\/stockmarketvidya.com\/blogs\/tag\/stock-market-fundamentals\/' rel='post_tag'>stock market fundamentals<\/a><a href='https:\/\/stockmarketvidya.com\/blogs\/tag\/stock-market-investing\/' rel='post_tag'>stock market investing<\/a><a href='https:\/\/stockmarketvidya.com\/blogs\/tag\/stock-market-learning-institute-nagpur\/' rel='post_tag'>stock market learning institute Nagpur<\/a><a href='https:\/\/stockmarketvidya.com\/blogs\/tag\/stock-market-training-nagpur\/' rel='post_tag'>stock market training Nagpur<\/a><a href='https:\/\/stockmarketvidya.com\/blogs\/tag\/technical-analysis-course-nagpur\/' rel='post_tag'>technical analysis course Nagpur<\/a><a href='https:\/\/stockmarketvidya.com\/blogs\/tag\/trading-classes-nagpur\/' rel='post_tag'>trading classes Nagpur<\/a><a href='https:\/\/stockmarketvidya.com\/blogs\/tag\/trading-psychology\/' rel='post_tag'>Trading Psychology<\/a><a href='https:\/\/stockmarketvidya.com\/blogs\/tag\/wealth-creation\/' rel='post_tag'>wealth creation<\/a>"},"readTime":{"min":17,"sec":6},"status":"publish","excerpt":""},{"id":947,"link":"https:\/\/stockmarketvidya.com\/blogs\/%e0%a4%95%e0%a4%ae%e0%a4%aa%e0%a5%82%e0%a4%82%e0%a4%9c%e0%a5%80%e0%a4%95%e0%a5%87%e0%a4%b8%e0%a4%be%e0%a4%a5%e0%a4%ad%e0%a4%be%e0%a4%b0%e0%a4%a4%e0%a4%ae%e0%a5%87%e0%a4%82%e0%a4%95%e0%a4%ae%e0%a5%8b\/","name":"%e0%a4%95%e0%a4%ae%e0%a4%aa%e0%a5%82%e0%a4%82%e0%a4%9c%e0%a5%80%e0%a4%95%e0%a5%87%e0%a4%b8%e0%a4%be%e0%a4%a5%e0%a4%ad%e0%a4%be%e0%a4%b0%e0%a4%a4%e0%a4%ae%e0%a5%87%e0%a4%82%e0%a4%95%e0%a4%ae%e0%a5%8b","thumbnail":{"url":"https:\/\/stockmarketvidya.com\/blogs\/wp-content\/uploads\/2026\/06\/\u0915\u092e\u094b\u0921\u093f\u091f\u0940-\u091f\u094d\u0930\u0947\u0921\u093f\u0902\u0917-\u0938\u0947-\u0936\u0941\u0930\u0941\u0906\u0924-\u0915\u0930\u0947\u0902-1.png","alt":"\u0915\u092e\u092a\u0942\u0902\u091c\u0940\u0915\u0947\u0938\u093e\u0925\u092d\u093e\u0930\u0924\u092e\u0947\u0902\u0915\u092e\u094b\u0921\u093f\u091f\u0940\u091f\u094d\u0930\u0947\u0921\u093f\u0902\u0917\u0915\u0948\u0938\u0947\u0936\u0941\u0930\u0942\u0915\u0930\u0947\u0902: \u0938\u094d\u092e\u093e\u0930\u094d\u091f\u0936\u0941\u0930\u0941\u0906\u0924\u0940\u0932\u094b\u0917\u094b\u0902\u0915\u0947\u0932\u093f\u090f\u090f\u0915\u0935\u094d\u092f\u093e\u0935\u0939\u093e\u0930\u093f\u0915\u092e\u093e\u0930\u094d\u0917\u0926\u0930\u094d\u0936\u093f\u0915\u093e"},"title":"\u0915\u092e\u092a\u0942\u0902\u091c\u0940 \u0915\u0947 \u0938\u093e\u0925 \u092d\u093e\u0930\u0924 \u092e\u0947\u0902 \u0915\u092e\u094b\u0921\u093f\u091f\u0940 \u091f\u094d\u0930\u0947\u0921\u093f\u0902\u0917 \u0915\u0948\u0938\u0947 \u0936\u0941\u0930\u0942 \u0915\u0930\u0947\u0902: \u0938\u094d\u092e\u093e\u0930\u094d\u091f \u0936\u0941\u0930\u0941\u0906\u0924\u0940 \u0932\u094b\u0917\u094b\u0902 \u0915\u0947 \u0932\u093f\u090f \u090f\u0915 \u0935\u094d\u092f\u093e\u0935\u0939\u093e\u0930\u093f\u0915 \u092e\u093e\u0930\u094d\u0917\u0926\u0930\u094d\u0936\u093f\u0915\u093e","author":{"name":"Share Market Blog","link":"https:\/\/stockmarketvidya.com\/blogs\/author\/share-market-blog\/"},"date":"Jun 15, 2026","dateGMT":"2026-06-15 06:08:20","modifiedDate":"2026-06-15 06:13:21","modifiedDateGMT":"2026-06-15 06:13:21","commentCount":"0","commentStatus":"open","categories":{"coma":"<a href=\"https:\/\/stockmarketvidya.com\/blogs\/category\/share-market\/\" rel=\"category tag\">Share Market<\/a>","space":"<a href=\"https:\/\/stockmarketvidya.com\/blogs\/category\/share-market\/\" rel=\"category tag\">Share Market<\/a>"},"taxonomies":{"post_tag":"<a href='https:\/\/stockmarketvidya.com\/blogs\/tag\/mcx-%e0%a4%9f%e0%a5%8d%e0%a4%b0%e0%a5%87%e0%a4%a1%e0%a4%bf%e0%a4%82%e0%a4%97\/' rel='post_tag'>MCX \u091f\u094d\u0930\u0947\u0921\u093f\u0902\u0917<\/a><a href='https:\/\/stockmarketvidya.com\/blogs\/tag\/ncdex-%e0%a4%9f%e0%a5%8d%e0%a4%b0%e0%a5%87%e0%a4%a1%e0%a4%bf%e0%a4%82%e0%a4%97\/' rel='post_tag'>NCDEX \u091f\u094d\u0930\u0947\u0921\u093f\u0902\u0917<\/a><a href='https:\/\/stockmarketvidya.com\/blogs\/tag\/%e0%a4%95%e0%a4%ae-%e0%a4%aa%e0%a5%82%e0%a4%82%e0%a4%9c%e0%a5%80-%e0%a4%95%e0%a4%ae%e0%a5%8b%e0%a4%a1%e0%a4%bf%e0%a4%9f%e0%a5%80-%e0%a4%9f%e0%a5%8d%e0%a4%b0%e0%a5%87%e0%a4%a1%e0%a4%bf%e0%a4%82\/' rel='post_tag'>\u0915\u092e \u092a\u0942\u0902\u091c\u0940 \u0915\u092e\u094b\u0921\u093f\u091f\u0940 \u091f\u094d\u0930\u0947\u0921\u093f\u0902\u0917<\/a><a href='https:\/\/stockmarketvidya.com\/blogs\/tag\/%e0%a4%95%e0%a4%ae%e0%a5%8b%e0%a4%a1%e0%a4%bf%e0%a4%9f%e0%a5%80-%e0%a4%9f%e0%a5%8d%e0%a4%b0%e0%a5%87%e0%a4%a1%e0%a4%bf%e0%a4%82%e0%a4%97-%e0%a4%ad%e0%a4%be%e0%a4%b0%e0%a4%a4\/' rel='post_tag'>\u0915\u092e\u094b\u0921\u093f\u091f\u0940 \u091f\u094d\u0930\u0947\u0921\u093f\u0902\u0917 \u092d\u093e\u0930\u0924<\/a><a href='https:\/\/stockmarketvidya.com\/blogs\/tag\/%e0%a4%95%e0%a4%ae%e0%a5%8b%e0%a4%a1%e0%a4%bf%e0%a4%9f%e0%a5%80-%e0%a4%9f%e0%a5%8d%e0%a4%b0%e0%a5%87%e0%a4%a1%e0%a4%bf%e0%a4%82%e0%a4%97-%e0%a4%b6%e0%a5%81%e0%a4%b0%e0%a5%81%e0%a4%86%e0%a4%a4%e0%a5%80\/' rel='post_tag'>\u0915\u092e\u094b\u0921\u093f\u091f\u0940 \u091f\u094d\u0930\u0947\u0921\u093f\u0902\u0917 \u0936\u0941\u0930\u0941\u0906\u0924\u0940<\/a><a href='https:\/\/stockmarketvidya.com\/blogs\/tag\/%e0%a4%95%e0%a4%ae%e0%a5%8b%e0%a4%a1%e0%a4%bf%e0%a4%9f%e0%a5%80-%e0%a4%a8%e0%a4%bf%e0%a4%b5%e0%a5%87%e0%a4%b6\/' rel='post_tag'>\u0915\u092e\u094b\u0921\u093f\u091f\u0940 \u0928\u093f\u0935\u0947\u0936<\/a><a href='https:\/\/stockmarketvidya.com\/blogs\/tag\/%e0%a4%95%e0%a4%ae%e0%a5%8b%e0%a4%a1%e0%a4%bf%e0%a4%9f%e0%a5%80-%e0%a4%ae%e0%a4%be%e0%a4%b0%e0%a5%8d%e0%a4%95%e0%a5%87%e0%a4%9f-%e0%a4%97%e0%a4%be%e0%a4%87%e0%a4%a1\/' rel='post_tag'>\u0915\u092e\u094b\u0921\u093f\u091f\u0940 \u092e\u093e\u0930\u094d\u0915\u0947\u091f \u0917\u093e\u0907\u0921<\/a><a href='https:\/\/stockmarketvidya.com\/blogs\/tag\/%e0%a4%9c%e0%a5%8b%e0%a4%96%e0%a4%bf%e0%a4%ae-%e0%a4%aa%e0%a5%8d%e0%a4%b0%e0%a4%ac%e0%a4%82%e0%a4%a7%e0%a4%a8\/' rel='post_tag'>\u091c\u094b\u0916\u093f\u092e \u092a\u094d\u0930\u092c\u0902\u0927\u0928<\/a><a href='https:\/\/stockmarketvidya.com\/blogs\/tag\/%e0%a4%9f%e0%a5%8d%e0%a4%b0%e0%a5%87%e0%a4%a1%e0%a4%bf%e0%a4%82%e0%a4%97-%e0%a4%9c%e0%a4%b0%e0%a5%8d%e0%a4%a8%e0%a4%b2\/' rel='post_tag'>\u091f\u094d\u0930\u0947\u0921\u093f\u0902\u0917 \u091c\u0930\u094d\u0928\u0932<\/a><a href='https:\/\/stockmarketvidya.com\/blogs\/tag\/%e0%a4%9f%e0%a5%8d%e0%a4%b0%e0%a5%87%e0%a4%a1%e0%a4%bf%e0%a4%82%e0%a4%97-%e0%a4%b0%e0%a4%a3%e0%a4%a8%e0%a5%80%e0%a4%a4%e0%a4%bf\/' rel='post_tag'>\u091f\u094d\u0930\u0947\u0921\u093f\u0902\u0917 \u0930\u0923\u0928\u0940\u0924\u093f<\/a><a href='https:\/\/stockmarketvidya.com\/blogs\/tag\/%e0%a4%9f%e0%a5%8d%e0%a4%b0%e0%a5%87%e0%a4%a1%e0%a4%bf%e0%a4%82%e0%a4%97-%e0%a4%b6%e0%a4%bf%e0%a4%95%e0%a5%8d%e0%a4%b7%e0%a4%be\/' rel='post_tag'>\u091f\u094d\u0930\u0947\u0921\u093f\u0902\u0917 \u0936\u093f\u0915\u094d\u0937\u093e<\/a><a href='https:\/\/stockmarketvidya.com\/blogs\/tag\/%e0%a4%a4%e0%a4%95%e0%a4%a8%e0%a5%80%e0%a4%95%e0%a5%80-%e0%a4%b5%e0%a4%bf%e0%a4%b6%e0%a5%8d%e0%a4%b2%e0%a5%87%e0%a4%b7%e0%a4%a3\/' rel='post_tag'>\u0924\u0915\u0928\u0940\u0915\u0940 \u0935\u093f\u0936\u094d\u0932\u0947\u0937\u0923<\/a><a href='https:\/\/stockmarketvidya.com\/blogs\/tag\/%e0%a4%ab%e0%a5%8d%e0%a4%af%e0%a5%82%e0%a4%9a%e0%a4%b0%e0%a5%8d%e0%a4%b8-%e0%a4%9f%e0%a5%8d%e0%a4%b0%e0%a5%87%e0%a4%a1%e0%a4%bf%e0%a4%82%e0%a4%97\/' rel='post_tag'>\u092b\u094d\u092f\u0942\u091a\u0930\u094d\u0938 \u091f\u094d\u0930\u0947\u0921\u093f\u0902\u0917<\/a><a href='https:\/\/stockmarketvidya.com\/blogs\/tag\/%e0%a4%ae%e0%a4%be%e0%a4%b0%e0%a5%8d%e0%a4%9c%e0%a4%bf%e0%a4%a8-%e0%a4%9f%e0%a5%8d%e0%a4%b0%e0%a5%87%e0%a4%a1%e0%a4%bf%e0%a4%82%e0%a4%97\/' rel='post_tag'>\u092e\u093e\u0930\u094d\u091c\u093f\u0928 \u091f\u094d\u0930\u0947\u0921\u093f\u0902\u0917<\/a><a href='https:\/\/stockmarketvidya.com\/blogs\/tag\/%e0%a4%b6%e0%a5%87%e0%a4%af%e0%a4%b0-%e0%a4%ae%e0%a4%be%e0%a4%b0%e0%a5%8d%e0%a4%95%e0%a5%87%e0%a4%9f-%e0%a4%95%e0%a5%8b%e0%a4%b0%e0%a5%8d%e0%a4%b8\/' rel='post_tag'>\u0936\u0947\u092f\u0930 \u092e\u093e\u0930\u094d\u0915\u0947\u091f \u0915\u094b\u0930\u094d\u0938<\/a>"},"readTime":{"min":6,"sec":24},"status":"publish","excerpt":""},{"id":943,"link":"https:\/\/stockmarketvidya.com\/blogs\/top-10-gdp-nations-and-india-understanding-the-global-economy-and-indias-growing-strength\/","name":"top-10-gdp-nations-and-india-understanding-the-global-economy-and-indias-growing-strength","thumbnail":{"url":"https:\/\/stockmarketvidya.com\/blogs\/wp-content\/uploads\/2026\/06\/Top-10-GDP-nations-and-India.png","alt":""},"title":"Top 10 GDP Nations and India: Understanding the Global Economy and India\u2019s Growing Strength","author":{"name":"Share Market Blog","link":"https:\/\/stockmarketvidya.com\/blogs\/author\/share-market-blog\/"},"date":"Jun 11, 2026","dateGMT":"2026-06-11 05:42:01","modifiedDate":"2026-06-11 05:42:03","modifiedDateGMT":"2026-06-11 05:42:03","commentCount":"0","commentStatus":"open","categories":{"coma":"<a href=\"https:\/\/stockmarketvidya.com\/blogs\/category\/share-market\/\" rel=\"category tag\">Share Market<\/a>, <a href=\"https:\/\/stockmarketvidya.com\/blogs\/category\/gdp\/\" rel=\"category tag\">GDP<\/a>, <a href=\"https:\/\/stockmarketvidya.com\/blogs\/category\/share-market-course\/\" rel=\"category tag\">Share Market Course<\/a>","space":"<a href=\"https:\/\/stockmarketvidya.com\/blogs\/category\/share-market\/\" rel=\"category tag\">Share Market<\/a> <a href=\"https:\/\/stockmarketvidya.com\/blogs\/category\/gdp\/\" rel=\"category tag\">GDP<\/a> <a href=\"https:\/\/stockmarketvidya.com\/blogs\/category\/share-market-course\/\" rel=\"category tag\">Share Market Course<\/a>"},"taxonomies":{"post_tag":"<a href='https:\/\/stockmarketvidya.com\/blogs\/tag\/economic-growth\/' rel='post_tag'>Economic Growth<\/a><a href='https:\/\/stockmarketvidya.com\/blogs\/tag\/economic-indicators\/' rel='post_tag'>economic indicators<\/a><a href='https:\/\/stockmarketvidya.com\/blogs\/tag\/fundamental-analysis\/' rel='post_tag'>Fundamental Analysis<\/a><a href='https:\/\/stockmarketvidya.com\/blogs\/tag\/gdp-and-stock-market\/' rel='post_tag'>GDP and stock market<\/a><a href='https:\/\/stockmarketvidya.com\/blogs\/tag\/gdp-for-investors\/' rel='post_tag'>GDP for Investors<\/a><a href='https:\/\/stockmarketvidya.com\/blogs\/tag\/gdp-impact-on-stocks\/' rel='post_tag'>GDP Impact on Stocks<\/a><a href='https:\/\/stockmarketvidya.com\/blogs\/tag\/gdp-ranking-countries\/' rel='post_tag'>GDP Ranking Countries<\/a><a href='https:\/\/stockmarketvidya.com\/blogs\/tag\/global-economy\/' rel='post_tag'>Global Economy<\/a><a href='https:\/\/stockmarketvidya.com\/blogs\/tag\/india-gdp-growth\/' rel='post_tag'>India GDP Growth<\/a><a href='https:\/\/stockmarketvidya.com\/blogs\/tag\/indian-economy\/' rel='post_tag'>Indian Economy<\/a><a href='https:\/\/stockmarketvidya.com\/blogs\/tag\/investment-knowledge\/' rel='post_tag'>Investment Knowledge<\/a><a href='https:\/\/stockmarketvidya.com\/blogs\/tag\/share-market-learning\/' rel='post_tag'>share market learning<\/a><a href='https:\/\/stockmarketvidya.com\/blogs\/tag\/stock-market-education\/' rel='post_tag'>Stock market education<\/a><a href='https:\/\/stockmarketvidya.com\/blogs\/tag\/top-gdp-nations\/' rel='post_tag'>Top GDP Nations<\/a><a href='https:\/\/stockmarketvidya.com\/blogs\/tag\/trading-psychology\/' rel='post_tag'>Trading Psychology<\/a>"},"readTime":{"min":9,"sec":58},"status":"publish","excerpt":""},{"id":934,"link":"https:\/\/stockmarketvidya.com\/blogs\/common-mistakes-new-raders-make-and-how-to-avoid-them\/","name":"common-mistakes-new-raders-make-and-how-to-avoid-them","thumbnail":{"url":"https:\/\/stockmarketvidya.com\/blogs\/wp-content\/uploads\/2026\/06\/Common-Mistakes-New-Traders-Make-and-How-to-Avoid-Them.png","alt":"Common Mistakes New Traders Make (and How to Avoid Them)"},"title":"Common Mistakes New Traders Make (and How to Avoid Them)","author":{"name":"Share Market Blog","link":"https:\/\/stockmarketvidya.com\/blogs\/author\/share-market-blog\/"},"date":"Jun 10, 2026","dateGMT":"2026-06-10 12:52:45","modifiedDate":"2026-06-11 04:33:51","modifiedDateGMT":"2026-06-11 04:33:51","commentCount":"0","commentStatus":"open","categories":{"coma":"<a href=\"https:\/\/stockmarketvidya.com\/blogs\/category\/share-market-course\/\" rel=\"category tag\">Share Market Course<\/a>, <a href=\"https:\/\/stockmarketvidya.com\/blogs\/category\/share-market\/\" rel=\"category tag\">Share Market<\/a>","space":"<a href=\"https:\/\/stockmarketvidya.com\/blogs\/category\/share-market-course\/\" rel=\"category tag\">Share Market Course<\/a> <a href=\"https:\/\/stockmarketvidya.com\/blogs\/category\/share-market\/\" rel=\"category tag\">Share Market<\/a>"},"taxonomies":{"post_tag":"<a href='https:\/\/stockmarketvidya.com\/blogs\/tag\/beginner-trading-tips\/' rel='post_tag'>beginner trading tips<\/a><a href='https:\/\/stockmarketvidya.com\/blogs\/tag\/common-stock-market-trading-mistakes\/' rel='post_tag'>common stock market trading mistakes<\/a><a href='https:\/\/stockmarketvidya.com\/blogs\/tag\/financial-education\/' rel='post_tag'>financial education<\/a><a href='https:\/\/stockmarketvidya.com\/blogs\/tag\/market-analysis\/' rel='post_tag'>market analysis<\/a><a href='https:\/\/stockmarketvidya.com\/blogs\/tag\/overtrading-mistakes\/' rel='post_tag'>overtrading mistakes<\/a><a href='https:\/\/stockmarketvidya.com\/blogs\/tag\/risk-management-in-trading\/' rel='post_tag'>risk management in trading<\/a><a href='https:\/\/stockmarketvidya.com\/blogs\/tag\/share-market-course\/' rel='post_tag'>Share Market Course<\/a><a href='https:\/\/stockmarketvidya.com\/blogs\/tag\/share-market-learning\/' rel='post_tag'>share market learning<\/a><a href='https:\/\/stockmarketvidya.com\/blogs\/tag\/stock-market-education\/' rel='post_tag'>Stock market education<\/a><a href='https:\/\/stockmarketvidya.com\/blogs\/tag\/stock-market-investing\/' rel='post_tag'>stock market investing<\/a><a href='https:\/\/stockmarketvidya.com\/blogs\/tag\/stock-market-trading-for-beginners\/' rel='post_tag'>stock market trading for beginners<\/a><a href='https:\/\/stockmarketvidya.com\/blogs\/tag\/stock-market-training-india\/' rel='post_tag'>stock market training India<\/a><a href='https:\/\/stockmarketvidya.com\/blogs\/tag\/stock-trading-strategies\/' rel='post_tag'>stock trading strategies<\/a><a href='https:\/\/stockmarketvidya.com\/blogs\/tag\/stop-loss-strategy\/' rel='post_tag'>stop loss strategy<\/a><a href='https:\/\/stockmarketvidya.com\/blogs\/tag\/technical-analysis-basics\/' rel='post_tag'>Technical Analysis Basics<\/a><a href='https:\/\/stockmarketvidya.com\/blogs\/tag\/trading-discipline\/' rel='post_tag'>trading discipline<\/a><a href='https:\/\/stockmarketvidya.com\/blogs\/tag\/trading-journal\/' rel='post_tag'>trading journal<\/a><a href='https:\/\/stockmarketvidya.com\/blogs\/tag\/trading-mistakes-to-avoid\/' rel='post_tag'>trading mistakes to avoid<\/a><a href='https:\/\/stockmarketvidya.com\/blogs\/tag\/trading-psychology\/' rel='post_tag'>Trading Psychology<\/a><a href='https:\/\/stockmarketvidya.com\/blogs\/tag\/trading-success-tips\/' rel='post_tag'>trading success tips<\/a>"},"readTime":{"min":13,"sec":52},"status":"publish","excerpt":""},{"id":925,"link":"https:\/\/stockmarketvidya.com\/blogs\/%e0%a4%85%e0%a4%82%e0%a4%a4%e0%a4%b0-%e0%a4%85%e0%a4%a8%e0%a5%81%e0%a4%ac%e0%a4%82%e0%a4%a7-%e0%a4%b5%e0%a5%8d%e0%a4%af%e0%a4%be%e0%a4%aa%e0%a4%be%e0%a4%b0-%e0%a4%94%e0%a4%b0-%e0%a4%b6%e0%a5%87\/","name":"%e0%a4%85%e0%a4%82%e0%a4%a4%e0%a4%b0-%e0%a4%85%e0%a4%a8%e0%a5%81%e0%a4%ac%e0%a4%82%e0%a4%a7-%e0%a4%b5%e0%a5%8d%e0%a4%af%e0%a4%be%e0%a4%aa%e0%a4%be%e0%a4%b0-%e0%a4%94%e0%a4%b0-%e0%a4%b6%e0%a5%87","thumbnail":{"url":"https:\/\/stockmarketvidya.com\/blogs\/wp-content\/uploads\/2026\/06\/\u0905\u0902\u0924\u0930-\u0905\u0928\u0941\u092c\u0902\u0927-\u0935\u094d\u092f\u093e\u092a\u093e\u0930-\u0914\u0930-\u0936\u0947\u092f\u0930-\u0935\u094d\u092f\u093e\u092a\u093e\u0930-\u0906\u092a\u0915\u0940-\u0928\u093f\u0935\u0947\u0936-\u092f\u093e\u0924\u094d\u0930\u093e-\u0915\u0947-\u0932\u093f\u090f-\u0915\u094c\u0928-\u0938\u093e-\u0935\u093f\u0915\u0932\u094d\u092a-\u0909\u092a\u092f\u0941\u0915\u094d\u0924-\u0939\u0948.png","alt":"\u0905\u0902\u0924\u0930 \u0905\u0928\u0941\u092c\u0902\u0927 \u0935\u094d\u092f\u093e\u092a\u093e\u0930 \u0914\u0930 \u0936\u0947\u092f\u0930 \u0935\u094d\u092f\u093e\u092a\u093e\u0930 \u0906\u092a\u0915\u0940 \u0928\u093f\u0935\u0947\u0936 \u092f\u093e\u0924\u094d\u0930\u093e \u0915\u0947 \u0932\u093f\u090f \u0915\u094c\u0928 \u0938\u093e \u0935\u093f\u0915\u0932\u094d\u092a \u0909\u092a\u092f\u0941\u0915\u094d\u0924 \u0939\u0948"},"title":"\u0905\u0902\u0924\u0930 \u0905\u0928\u0941\u092c\u0902\u0927 \u0935\u094d\u092f\u093e\u092a\u093e\u0930 \u0914\u0930 \u0936\u0947\u092f\u0930 \u0935\u094d\u092f\u093e\u092a\u093e\u0930: \u0906\u092a\u0915\u0940 \u0928\u093f\u0935\u0947\u0936 \u092f\u093e\u0924\u094d\u0930\u093e \u0915\u0947 \u0932\u093f\u090f \u0915\u094c\u0928 \u0938\u093e \u0935\u093f\u0915\u0932\u094d\u092a \u0909\u092a\u092f\u0941\u0915\u094d\u0924 \u0939\u0948?","author":{"name":"Share Market Blog","link":"https:\/\/stockmarketvidya.com\/blogs\/author\/share-market-blog\/"},"date":"Jun 5, 2026","dateGMT":"2026-06-05 06:44:01","modifiedDate":"2026-06-05 06:44:03","modifiedDateGMT":"2026-06-05 06:44:03","commentCount":"0","commentStatus":"open","categories":{"coma":"<a href=\"https:\/\/stockmarketvidya.com\/blogs\/category\/share-market\/\" rel=\"category tag\">Share Market<\/a>, <a href=\"https:\/\/stockmarketvidya.com\/blogs\/category\/share-market-course\/\" rel=\"category tag\">Share Market Course<\/a>","space":"<a href=\"https:\/\/stockmarketvidya.com\/blogs\/category\/share-market\/\" rel=\"category tag\">Share Market<\/a> <a href=\"https:\/\/stockmarketvidya.com\/blogs\/category\/share-market-course\/\" rel=\"category tag\">Share Market Course<\/a>"},"taxonomies":{"post_tag":"<a href='https:\/\/stockmarketvidya.com\/blogs\/tag\/cfd-trading\/' rel='post_tag'>CFD trading<\/a><a href='https:\/\/stockmarketvidya.com\/blogs\/tag\/cfd-vs-share-trading\/' rel='post_tag'>CFD vs share trading<\/a><a href='https:\/\/stockmarketvidya.com\/blogs\/tag\/share-trading\/' rel='post_tag'>share trading<\/a><a href='https:\/\/stockmarketvidya.com\/blogs\/tag\/%e0%a4%85%e0%a4%b2%e0%a5%8d%e0%a4%aa%e0%a4%95%e0%a4%be%e0%a4%b2%e0%a4%bf%e0%a4%95-%e0%a4%9f%e0%a5%8d%e0%a4%b0%e0%a5%87%e0%a4%a1%e0%a4%bf%e0%a4%82%e0%a4%97\/' rel='post_tag'>\u0905\u0932\u094d\u092a\u0915\u093e\u0932\u093f\u0915 \u091f\u094d\u0930\u0947\u0921\u093f\u0902\u0917<\/a><a href='https:\/\/stockmarketvidya.com\/blogs\/tag\/%e0%a4%87%e0%a4%95%e0%a5%8d%e0%a4%b5%e0%a4%bf%e0%a4%9f%e0%a5%80-%e0%a4%a8%e0%a4%bf%e0%a4%b5%e0%a5%87%e0%a4%b6\/' rel='post_tag'>\u0907\u0915\u094d\u0935\u093f\u091f\u0940 \u0928\u093f\u0935\u0947\u0936<\/a><a href='https:\/\/stockmarketvidya.com\/blogs\/tag\/%e0%a4%9c%e0%a5%8b%e0%a4%96%e0%a4%bf%e0%a4%ae-%e0%a4%aa%e0%a5%8d%e0%a4%b0%e0%a4%ac%e0%a4%82%e0%a4%a7%e0%a4%a8\/' rel='post_tag'>\u091c\u094b\u0916\u093f\u092e \u092a\u094d\u0930\u092c\u0902\u0927\u0928<\/a><a href='https:\/\/stockmarketvidya.com\/blogs\/tag\/%e0%a4%9f%e0%a5%8d%e0%a4%b0%e0%a5%87%e0%a4%a1%e0%a4%bf%e0%a4%82%e0%a4%97-%e0%a4%94%e0%a4%b0-%e0%a4%a8%e0%a4%bf%e0%a4%b5%e0%a5%87%e0%a4%b6\/' rel='post_tag'>\u091f\u094d\u0930\u0947\u0921\u093f\u0902\u0917 \u0914\u0930 \u0928\u093f\u0935\u0947\u0936<\/a><a href='https:\/\/stockmarketvidya.com\/blogs\/tag\/%e0%a4%9f%e0%a5%8d%e0%a4%b0%e0%a5%87%e0%a4%a1%e0%a4%bf%e0%a4%82%e0%a4%97-%e0%a4%97%e0%a4%be%e0%a4%87%e0%a4%a1\/' rel='post_tag'>\u091f\u094d\u0930\u0947\u0921\u093f\u0902\u0917 \u0917\u093e\u0907\u0921<\/a><a href='https:\/\/stockmarketvidya.com\/blogs\/tag\/%e0%a4%a4%e0%a4%95%e0%a4%a8%e0%a5%80%e0%a4%95%e0%a5%80-%e0%a4%b5%e0%a4%bf%e0%a4%b6%e0%a5%8d%e0%a4%b2%e0%a5%87%e0%a4%b7%e0%a4%a3\/' rel='post_tag'>\u0924\u0915\u0928\u0940\u0915\u0940 \u0935\u093f\u0936\u094d\u0932\u0947\u0937\u0923<\/a><a href='https:\/\/stockmarketvidya.com\/blogs\/tag\/%e0%a4%a6%e0%a5%80%e0%a4%b0%e0%a5%8d%e0%a4%98%e0%a4%95%e0%a4%be%e0%a4%b2%e0%a4%bf%e0%a4%95-%e0%a4%a8%e0%a4%bf%e0%a4%b5%e0%a5%87%e0%a4%b6\/' rel='post_tag'>\u0926\u0940\u0930\u094d\u0918\u0915\u093e\u0932\u093f\u0915 \u0928\u093f\u0935\u0947\u0936<\/a><a href='https:\/\/stockmarketvidya.com\/blogs\/tag\/%e0%a4%a8%e0%a4%bf%e0%a4%b5%e0%a5%87%e0%a4%b6-%e0%a4%b0%e0%a4%a3%e0%a4%a8%e0%a5%80%e0%a4%a4%e0%a4%bf\/' rel='post_tag'>\u0928\u093f\u0935\u0947\u0936 \u0930\u0923\u0928\u0940\u0924\u093f<\/a><a href='https:\/\/stockmarketvidya.com\/blogs\/tag\/%e0%a4%b5%e0%a4%bf%e0%a4%a4%e0%a5%8d%e0%a4%a4%e0%a5%80%e0%a4%af-%e0%a4%b6%e0%a4%bf%e0%a4%95%e0%a5%8d%e0%a4%b7%e0%a4%be\/' rel='post_tag'>\u0935\u093f\u0924\u094d\u0924\u0940\u092f \u0936\u093f\u0915\u094d\u0937\u093e<\/a><a href='https:\/\/stockmarketvidya.com\/blogs\/tag\/%e0%a4%b6%e0%a5%81%e0%a4%b0%e0%a5%81%e0%a4%86%e0%a4%a4%e0%a5%80-%e0%a4%a8%e0%a4%bf%e0%a4%b5%e0%a5%87%e0%a4%b6%e0%a4%95\/' rel='post_tag'>\u0936\u0941\u0930\u0941\u0906\u0924\u0940 \u0928\u093f\u0935\u0947\u0936\u0915<\/a><a href='https:\/\/stockmarketvidya.com\/blogs\/tag\/%e0%a4%b6%e0%a5%87%e0%a4%af%e0%a4%b0-%e0%a4%a8%e0%a4%bf%e0%a4%b5%e0%a5%87%e0%a4%b6\/' rel='post_tag'>\u0936\u0947\u092f\u0930 \u0928\u093f\u0935\u0947\u0936<\/a><a href='https:\/\/stockmarketvidya.com\/blogs\/tag\/%e0%a4%b6%e0%a5%87%e0%a4%af%e0%a4%b0-%e0%a4%ac%e0%a4%be%e0%a4%9c%e0%a4%be%e0%a4%b0\/' rel='post_tag'>\u0936\u0947\u092f\u0930 \u092c\u093e\u091c\u093e\u0930<\/a><a href='https:\/\/stockmarketvidya.com\/blogs\/tag\/%e0%a4%b6%e0%a5%87%e0%a4%af%e0%a4%b0-%e0%a4%ac%e0%a4%be%e0%a4%9c%e0%a4%be%e0%a4%b0-%e0%a4%aa%e0%a5%8d%e0%a4%b0%e0%a4%b6%e0%a4%bf%e0%a4%95%e0%a5%8d%e0%a4%b7%e0%a4%a3\/' rel='post_tag'>\u0936\u0947\u092f\u0930 \u092c\u093e\u091c\u093e\u0930 \u092a\u094d\u0930\u0936\u093f\u0915\u094d\u0937\u0923<\/a><a href='https:\/\/stockmarketvidya.com\/blogs\/tag\/%e0%a4%b6%e0%a5%87%e0%a4%af%e0%a4%b0-%e0%a4%ae%e0%a4%be%e0%a4%b0%e0%a5%8d%e0%a4%95%e0%a5%87%e0%a4%9f-%e0%a4%95%e0%a5%8b%e0%a4%b0%e0%a5%8d%e0%a4%b8\/' rel='post_tag'>\u0936\u0947\u092f\u0930 \u092e\u093e\u0930\u094d\u0915\u0947\u091f \u0915\u094b\u0930\u094d\u0938<\/a><a href='https:\/\/stockmarketvidya.com\/blogs\/tag\/%e0%a4%b8%e0%a5%8d%e0%a4%9f%e0%a5%89%e0%a4%95-%e0%a4%ae%e0%a4%be%e0%a4%b0%e0%a5%8d%e0%a4%95%e0%a5%87%e0%a4%9f-%e0%a4%95%e0%a5%8b%e0%a4%b0%e0%a5%8d%e0%a4%b8\/' rel='post_tag'>\u0938\u094d\u091f\u0949\u0915 \u092e\u093e\u0930\u094d\u0915\u0947\u091f \u0915\u094b\u0930\u094d\u0938<\/a><a href='https:\/\/stockmarketvidya.com\/blogs\/tag\/%e0%a4%b8%e0%a5%8d%e0%a4%9f%e0%a5%89%e0%a4%95-%e0%a4%ae%e0%a4%be%e0%a4%b0%e0%a5%8d%e0%a4%95%e0%a5%87%e0%a4%9f-%e0%a4%b5%e0%a4%bf%e0%a4%a6%e0%a5%8d%e0%a4%af%e0%a4%be\/' rel='post_tag'>\u0938\u094d\u091f\u0949\u0915 \u092e\u093e\u0930\u094d\u0915\u0947\u091f \u0935\u093f\u0926\u094d\u092f\u093e<\/a><a href='https:\/\/stockmarketvidya.com\/blogs\/tag\/%e0%a4%b8%e0%a5%8d%e0%a4%9f%e0%a5%89%e0%a4%95-%e0%a4%ae%e0%a4%be%e0%a4%b0%e0%a5%8d%e0%a4%95%e0%a5%87%e0%a4%9f-%e0%a4%b6%e0%a4%bf%e0%a4%95%e0%a5%8d%e0%a4%b7%e0%a4%be\/' rel='post_tag'>\u0938\u094d\u091f\u0949\u0915 \u092e\u093e\u0930\u094d\u0915\u0947\u091f \u0936\u093f\u0915\u094d\u0937\u093e<\/a>"},"readTime":{"min":5,"sec":42},"status":"publish","excerpt":""},{"id":927,"link":"https:\/\/stockmarketvidya.com\/blogs\/impact-of-us-market-on-our-market-understanding-the-connection-between-wall-street-and-indian-stock-market\/","name":"impact-of-us-market-on-our-market-understanding-the-connection-between-wall-street-and-indian-stock-market","thumbnail":{"url":"https:\/\/stockmarketvidya.com\/blogs\/wp-content\/uploads\/2026\/06\/Impact-of-US-Market-on-Our-Market-Understanding-the-Connection-Between-Wall-Street-and-Indian-Stock-Market.png","alt":"Impact of US Market on Our Market Understanding the Connection Between Wall Street and Indian Stock Market"},"title":"Impact of US Market on Our Market: Understanding the Connection Between Wall Street and Indian Stock Market","author":{"name":"Share Market Blog","link":"https:\/\/stockmarketvidya.com\/blogs\/author\/share-market-blog\/"},"date":"Jun 4, 2026","dateGMT":"2026-06-04 08:30:33","modifiedDate":"2026-06-04 08:30:35","modifiedDateGMT":"2026-06-04 08:30:35","commentCount":"0","commentStatus":"open","categories":{"coma":"<a href=\"https:\/\/stockmarketvidya.com\/blogs\/category\/share-market\/\" rel=\"category tag\">Share Market<\/a>","space":"<a href=\"https:\/\/stockmarketvidya.com\/blogs\/category\/share-market\/\" rel=\"category tag\">Share Market<\/a>"},"taxonomies":{"post_tag":"<a href='https:\/\/stockmarketvidya.com\/blogs\/tag\/federal-reserve-impact-on-india\/' rel='post_tag'>Federal Reserve Impact on India<\/a><a href='https:\/\/stockmarketvidya.com\/blogs\/tag\/fii-investment-in-india\/' rel='post_tag'>FII Investment in India<\/a><a href='https:\/\/stockmarketvidya.com\/blogs\/tag\/fundamental-analysis\/' rel='post_tag'>Fundamental Analysis<\/a><a href='https:\/\/stockmarketvidya.com\/blogs\/tag\/global-market-analysis\/' rel='post_tag'>Global Market Analysis<\/a><a href='https:\/\/stockmarketvidya.com\/blogs\/tag\/impact-of-us-market-on-indian-stock-market\/' rel='post_tag'>Impact of US Market on Indian Stock Market<\/a><a href='https:\/\/stockmarketvidya.com\/blogs\/tag\/indian-stock-market\/' rel='post_tag'>Indian stock market<\/a><a href='https:\/\/stockmarketvidya.com\/blogs\/tag\/nasdaq-and-indian-it-stocks\/' rel='post_tag'>NASDAQ and Indian IT Stocks<\/a><a href='https:\/\/stockmarketvidya.com\/blogs\/tag\/nifty-and-sensex-analysis\/' rel='post_tag'>Nifty and Sensex Analysis<\/a><a href='https:\/\/stockmarketvidya.com\/blogs\/tag\/share-market-course\/' rel='post_tag'>Share Market Course<\/a><a href='https:\/\/stockmarketvidya.com\/blogs\/tag\/share-market-learning\/' rel='post_tag'>share market learning<\/a><a href='https:\/\/stockmarketvidya.com\/blogs\/tag\/stock-market-education\/' rel='post_tag'>Stock market education<\/a><a href='https:\/\/stockmarketvidya.com\/blogs\/tag\/stock-market-for-beginners\/' rel='post_tag'>Stock market for beginners<\/a><a href='https:\/\/stockmarketvidya.com\/blogs\/tag\/stock-market-training-classes\/' rel='post_tag'>Stock Market Training Classes<\/a><a href='https:\/\/stockmarketvidya.com\/blogs\/tag\/stock-market-vidya\/' rel='post_tag'>Stock Market Vidya<\/a><a href='https:\/\/stockmarketvidya.com\/blogs\/tag\/technical-analysis\/' rel='post_tag'>Technical Analysis<\/a><a href='https:\/\/stockmarketvidya.com\/blogs\/tag\/trading-psychology\/' rel='post_tag'>Trading Psychology<\/a><a href='https:\/\/stockmarketvidya.com\/blogs\/tag\/us-market-and-indian-market-connection\/' rel='post_tag'>US Market and Indian Market Connection<\/a><a href='https:\/\/stockmarketvidya.com\/blogs\/tag\/us-market-influence-on-nifty\/' rel='post_tag'>US Market Influence on Nifty<\/a><a href='https:\/\/stockmarketvidya.com\/blogs\/tag\/wall-street-and-dalal-street\/' rel='post_tag'>Wall Street and Dalal Street<\/a>"},"readTime":{"min":11,"sec":45},"status":"publish","excerpt":""},{"id":921,"link":"https:\/\/stockmarketvidya.com\/blogs\/important-economic-data-a-complete-guide-for-smart-stock-market-trading\/","name":"important-economic-data-a-complete-guide-for-smart-stock-market-trading","thumbnail":{"url":"https:\/\/stockmarketvidya.com\/blogs\/wp-content\/uploads\/2026\/06\/Important-Economic-Data-A-Complete-Guide-for-Smart-Stock-Market-Trading.png","alt":"Important Economic Data A Complete Guide for Smart Stock Market Trading"},"title":"Important Economic Data: A Complete Guide for Smart Stock Market Trading","author":{"name":"Share Market Blog","link":"https:\/\/stockmarketvidya.com\/blogs\/author\/share-market-blog\/"},"date":"Jun 3, 2026","dateGMT":"2026-06-03 13:31:38","modifiedDate":"2026-06-03 13:31:41","modifiedDateGMT":"2026-06-03 13:31:41","commentCount":"0","commentStatus":"open","categories":{"coma":"<a href=\"https:\/\/stockmarketvidya.com\/blogs\/category\/share-market\/\" rel=\"category tag\">Share Market<\/a>, <a href=\"https:\/\/stockmarketvidya.com\/blogs\/category\/share-market-course\/\" rel=\"category tag\">Share Market Course<\/a>","space":"<a href=\"https:\/\/stockmarketvidya.com\/blogs\/category\/share-market\/\" rel=\"category tag\">Share Market<\/a> <a href=\"https:\/\/stockmarketvidya.com\/blogs\/category\/share-market-course\/\" rel=\"category tag\">Share Market Course<\/a>"},"taxonomies":{"post_tag":"<a href='https:\/\/stockmarketvidya.com\/blogs\/tag\/consumer-confidence-index\/' rel='post_tag'>consumer confidence index<\/a><a href='https:\/\/stockmarketvidya.com\/blogs\/tag\/corporate-earnings\/' rel='post_tag'>corporate earnings<\/a><a href='https:\/\/stockmarketvidya.com\/blogs\/tag\/crude-oil-prices\/' rel='post_tag'>crude oil prices<\/a><a href='https:\/\/stockmarketvidya.com\/blogs\/tag\/current-account-deficit\/' rel='post_tag'>current account deficit<\/a><a href='https:\/\/stockmarketvidya.com\/blogs\/tag\/economic-analysis\/' rel='post_tag'>economic analysis<\/a><a href='https:\/\/stockmarketvidya.com\/blogs\/tag\/economic-calendar\/' rel='post_tag'>economic calendar<\/a><a href='https:\/\/stockmarketvidya.com\/blogs\/tag\/economic-indicators\/' rel='post_tag'>economic indicators<\/a><a href='https:\/\/stockmarketvidya.com\/blogs\/tag\/economic-reports\/' rel='post_tag'>economic reports<\/a><a href='https:\/\/stockmarketvidya.com\/blogs\/tag\/employment-data-trading\/' rel='post_tag'>employment data trading<\/a><a href='https:\/\/stockmarketvidya.com\/blogs\/tag\/fiscal-deficit\/' rel='post_tag'>fiscal deficit<\/a><a href='https:\/\/stockmarketvidya.com\/blogs\/tag\/foreign-exchange-reserves\/' rel='post_tag'>foreign exchange reserves<\/a><a href='https:\/\/stockmarketvidya.com\/blogs\/tag\/fundamental-analysis\/' rel='post_tag'>Fundamental Analysis<\/a><a href='https:\/\/stockmarketvidya.com\/blogs\/tag\/gdp-and-stock-market\/' rel='post_tag'>GDP and stock market<\/a><a href='https:\/\/stockmarketvidya.com\/blogs\/tag\/housing-market-data\/' rel='post_tag'>housing market data<\/a><a href='https:\/\/stockmarketvidya.com\/blogs\/tag\/iip-data\/' rel='post_tag'>IIP data<\/a><a href='https:\/\/stockmarketvidya.com\/blogs\/tag\/important-economic-data\/' rel='post_tag'>important economic data<\/a><a href='https:\/\/stockmarketvidya.com\/blogs\/tag\/inflation-impact-on-stocks\/' rel='post_tag'>inflation impact on stocks<\/a><a href='https:\/\/stockmarketvidya.com\/blogs\/tag\/interest-rates-and-stocks\/' rel='post_tag'>interest rates and stocks<\/a><a href='https:\/\/stockmarketvidya.com\/blogs\/tag\/investment-fundamentals\/' rel='post_tag'>investment fundamentals<\/a><a href='https:\/\/stockmarketvidya.com\/blogs\/tag\/macroeconomic-indicators\/' rel='post_tag'>macroeconomic indicators<\/a><a href='https:\/\/stockmarketvidya.com\/blogs\/tag\/market-sentiment\/' rel='post_tag'>market sentiment<\/a><a href='https:\/\/stockmarketvidya.com\/blogs\/tag\/market-volatility\/' rel='post_tag'>market volatility<\/a><a href='https:\/\/stockmarketvidya.com\/blogs\/tag\/pmi-indicator\/' rel='post_tag'>PMI indicator<\/a><a href='https:\/\/stockmarketvidya.com\/blogs\/tag\/rbi-policy-and-market\/' rel='post_tag'>RBI policy and market<\/a><a href='https:\/\/stockmarketvidya.com\/blogs\/tag\/share-market-learning\/' rel='post_tag'>share market learning<\/a><a href='https:\/\/stockmarketvidya.com\/blogs\/tag\/stock-market-education\/' rel='post_tag'>Stock market education<\/a><a href='https:\/\/stockmarketvidya.com\/blogs\/tag\/stock-market-fundamentals\/' rel='post_tag'>stock market fundamentals<\/a><a href='https:\/\/stockmarketvidya.com\/blogs\/tag\/stock-market-trading\/' rel='post_tag'>Stock Market Trading<\/a><a href='https:\/\/stockmarketvidya.com\/blogs\/tag\/trading-education\/' rel='post_tag'>trading education<\/a><a href='https:\/\/stockmarketvidya.com\/blogs\/tag\/trading-strategies\/' rel='post_tag'>trading strategies<\/a>"},"readTime":{"min":8,"sec":57},"status":"publish","excerpt":""},{"id":905,"link":"https:\/\/stockmarketvidya.com\/blogs\/union-budget-and-stock-market-how-budget-impacts-traders-and-investors-in-india\/","name":"union-budget-and-stock-market-how-budget-impacts-traders-and-investors-in-india","thumbnail":{"url":"https:\/\/stockmarketvidya.com\/blogs\/wp-content\/uploads\/2026\/05\/ChatGPT-Image-May-30-2026-10_14_34-AM.png","alt":"Union Budget and Stock Market: How Budget Impacts Traders and Investors in India"},"title":"Union Budget and Stock Market: How Budget Impacts Traders and Investors in India","author":{"name":"Share Market Blog","link":"https:\/\/stockmarketvidya.com\/blogs\/author\/share-market-blog\/"},"date":"Jun 1, 2026","dateGMT":"2026-06-01 01:00:00","modifiedDate":"2026-05-30 06:35:24","modifiedDateGMT":"2026-05-30 06:35:24","commentCount":"0","commentStatus":"open","categories":{"coma":"<a href=\"https:\/\/stockmarketvidya.com\/blogs\/category\/share-market\/\" rel=\"category tag\">Share Market<\/a>, <a href=\"https:\/\/stockmarketvidya.com\/blogs\/category\/share-market-course\/\" rel=\"category tag\">Share Market Course<\/a>","space":"<a href=\"https:\/\/stockmarketvidya.com\/blogs\/category\/share-market\/\" rel=\"category tag\">Share Market<\/a> <a href=\"https:\/\/stockmarketvidya.com\/blogs\/category\/share-market-course\/\" rel=\"category tag\">Share Market Course<\/a>"},"taxonomies":{"post_tag":"<a href='https:\/\/stockmarketvidya.com\/blogs\/tag\/bank-nifty-trading\/' rel='post_tag'>Bank Nifty trading<\/a><a href='https:\/\/stockmarketvidya.com\/blogs\/tag\/beginner-trading-education\/' rel='post_tag'>beginner trading education<\/a><a href='https:\/\/stockmarketvidya.com\/blogs\/tag\/budget-and-banking-stocks\/' rel='post_tag'>budget and banking stocks<\/a><a href='https:\/\/stockmarketvidya.com\/blogs\/tag\/budget-and-infrastructure-stocks\/' rel='post_tag'>budget and infrastructure stocks<\/a><a href='https:\/\/stockmarketvidya.com\/blogs\/tag\/budget-and-investments\/' rel='post_tag'>budget and investments<\/a><a href='https:\/\/stockmarketvidya.com\/blogs\/tag\/budget-and-renewable-energy-stocks\/' rel='post_tag'>budget and renewable energy stocks<\/a><a href='https:\/\/stockmarketvidya.com\/blogs\/tag\/budget-day-trading-india\/' rel='post_tag'>budget day trading India<\/a><a href='https:\/\/stockmarketvidya.com\/blogs\/tag\/budget-impact-on-stock-market\/' rel='post_tag'>budget impact on stock market<\/a><a href='https:\/\/stockmarketvidya.com\/blogs\/tag\/budget-volatility-trading\/' rel='post_tag'>budget volatility trading<\/a><a href='https:\/\/stockmarketvidya.com\/blogs\/tag\/indian-stock-market-education\/' rel='post_tag'>Indian Stock Market Education<\/a><a href='https:\/\/stockmarketvidya.com\/blogs\/tag\/intraday-trading-during-budget\/' rel='post_tag'>intraday trading during budget<\/a><a href='https:\/\/stockmarketvidya.com\/blogs\/tag\/nifty-budget-impact\/' rel='post_tag'>Nifty budget impact<\/a><a href='https:\/\/stockmarketvidya.com\/blogs\/tag\/options-trading-budget-day\/' rel='post_tag'>options trading budget day<\/a><a href='https:\/\/stockmarketvidya.com\/blogs\/tag\/prashant-sarode\/' rel='post_tag'>Prashant Sarode<\/a><a href='https:\/\/stockmarketvidya.com\/blogs\/tag\/risk-management-trading\/' rel='post_tag'>risk management trading<\/a><a href='https:\/\/stockmarketvidya.com\/blogs\/tag\/sector-analysis-stock-market\/' rel='post_tag'>sector analysis stock market<\/a><a href='https:\/\/stockmarketvidya.com\/blogs\/tag\/sensex-budget-effect\/' rel='post_tag'>Sensex budget effect<\/a><a href='https:\/\/stockmarketvidya.com\/blogs\/tag\/share-market-classes-in-nagpur\/' rel='post_tag'>Share Market Classes in Nagpur<\/a><a href='https:\/\/stockmarketvidya.com\/blogs\/tag\/share-market-learning-india\/' rel='post_tag'>share market learning India<\/a><a href='https:\/\/stockmarketvidya.com\/blogs\/tag\/share-market-training-nagpur\/' rel='post_tag'>Share market training Nagpur<\/a><a href='https:\/\/stockmarketvidya.com\/blogs\/tag\/stock-market-budget-analysis\/' rel='post_tag'>stock market budget analysis<\/a><a href='https:\/\/stockmarketvidya.com\/blogs\/tag\/stock-market-classes-in-nagpur\/' rel='post_tag'>stock market classes in Nagpur<\/a><a href='https:\/\/stockmarketvidya.com\/blogs\/tag\/stock-market-course-in-nagpur\/' rel='post_tag'>stock market course in Nagpur<\/a><a href='https:\/\/stockmarketvidya.com\/blogs\/tag\/stock-market-vidya\/' rel='post_tag'>Stock Market Vidya<\/a><a href='https:\/\/stockmarketvidya.com\/blogs\/tag\/technical-analysis-for-budget-trading\/' rel='post_tag'>technical analysis for budget trading<\/a><a href='https:\/\/stockmarketvidya.com\/blogs\/tag\/trading-psychology-india\/' rel='post_tag'>Trading Psychology India<\/a><a href='https:\/\/stockmarketvidya.com\/blogs\/tag\/union-budget-and-stock-market\/' rel='post_tag'>union budget and stock market<\/a><a href='https:\/\/stockmarketvidya.com\/blogs\/tag\/union-budget-trading-strategy\/' rel='post_tag'>union budget trading strategy<\/a>"},"readTime":{"min":16,"sec":11},"status":"publish","excerpt":""},{"id":910,"link":"https:\/\/stockmarketvidya.com\/blogs\/algo-trading-%e0%a4%95%e0%a5%8d%e0%a4%af%e0%a4%be-%e0%a4%b9%e0%a5%88-%e0%a4%ad%e0%a4%be%e0%a4%b0%e0%a4%a4-%e0%a4%ae%e0%a5%87%e0%a4%82-%e0%a4%b6%e0%a5%81%e0%a4%b0%e0%a5%81%e0%a4%86%e0%a4%a4%e0%a5%80\/","name":"algo-trading-%e0%a4%95%e0%a5%8d%e0%a4%af%e0%a4%be-%e0%a4%b9%e0%a5%88-%e0%a4%ad%e0%a4%be%e0%a4%b0%e0%a4%a4-%e0%a4%ae%e0%a5%87%e0%a4%82-%e0%a4%b6%e0%a5%81%e0%a4%b0%e0%a5%81%e0%a4%86%e0%a4%a4%e0%a5%80","thumbnail":{"url":"https:\/\/stockmarketvidya.com\/blogs\/wp-content\/uploads\/2026\/05\/ChatGPT-Image-May-30-2026-10_12_04-AM.png","alt":"Algo Trading \u0915\u094d\u092f\u093e \u0939\u0948? \u092d\u093e\u0930\u0924 \u092e\u0947\u0902 \u0936\u0941\u0930\u0941\u0906\u0924\u0940 \u0932\u094b\u0917\u094b\u0902 \u0915\u0947 \u0932\u093f\u090f \u092a\u0942\u0930\u0940 \u0917\u093e\u0907\u0921"},"title":"Algo Trading \u0915\u094d\u092f\u093e \u0939\u0948? \u092d\u093e\u0930\u0924 \u092e\u0947\u0902 \u0936\u0941\u0930\u0941\u0906\u0924\u0940 \u0932\u094b\u0917\u094b\u0902 \u0915\u0947 \u0932\u093f\u090f \u092a\u0942\u0930\u0940 \u0917\u093e\u0907\u0921","author":{"name":"Share Market Blog","link":"https:\/\/stockmarketvidya.com\/blogs\/author\/share-market-blog\/"},"date":"May 30, 2026","dateGMT":"2026-05-30 06:01:36","modifiedDate":"2026-05-30 06:22:05","modifiedDateGMT":"2026-05-30 06:22:05","commentCount":"0","commentStatus":"open","categories":{"coma":"<a href=\"https:\/\/stockmarketvidya.com\/blogs\/category\/share-market\/\" rel=\"category tag\">Share Market<\/a>, <a href=\"https:\/\/stockmarketvidya.com\/blogs\/category\/share-market-course\/\" rel=\"category tag\">Share Market Course<\/a>","space":"<a href=\"https:\/\/stockmarketvidya.com\/blogs\/category\/share-market\/\" rel=\"category tag\">Share Market<\/a> <a href=\"https:\/\/stockmarketvidya.com\/blogs\/category\/share-market-course\/\" rel=\"category tag\">Share Market Course<\/a>"},"taxonomies":{"post_tag":"<a href='https:\/\/stockmarketvidya.com\/blogs\/tag\/algo-trading-for-beginners\/' rel='post_tag'>algo trading for beginners<\/a><a href='https:\/\/stockmarketvidya.com\/blogs\/tag\/algo-trading-in-india\/' rel='post_tag'>algo trading in india<\/a><a href='https:\/\/stockmarketvidya.com\/blogs\/tag\/algo-trading-strategies\/' rel='post_tag'>algo trading strategies<\/a><a href='https:\/\/stockmarketvidya.com\/blogs\/tag\/automated-trading-india\/' rel='post_tag'>automated trading india<\/a><a href='https:\/\/stockmarketvidya.com\/blogs\/tag\/best-share-market-classes\/' rel='post_tag'>best share market classes<\/a><a href='https:\/\/stockmarketvidya.com\/blogs\/tag\/futures-and-options-training\/' rel='post_tag'>futures and options training<\/a><a href='https:\/\/stockmarketvidya.com\/blogs\/tag\/intraday-trading-course\/' rel='post_tag'>Intraday Trading Course<\/a><a href='https:\/\/stockmarketvidya.com\/blogs\/tag\/option-trading-course\/' rel='post_tag'>option trading course<\/a><a href='https:\/\/stockmarketvidya.com\/blogs\/tag\/prashant-sarode\/' rel='post_tag'>Prashant Sarode<\/a><a href='https:\/\/stockmarketvidya.com\/blogs\/tag\/share-market-classes-nagpur\/' rel='post_tag'>share market classes Nagpur<\/a><a href='https:\/\/stockmarketvidya.com\/blogs\/tag\/share-market-institute-nagpur\/' rel='post_tag'>share market institute nagpur<\/a><a href='https:\/\/stockmarketvidya.com\/blogs\/tag\/stock-market-course-india\/' rel='post_tag'>stock market course India<\/a><a href='https:\/\/stockmarketvidya.com\/blogs\/tag\/stock-market-education\/' rel='post_tag'>Stock market education<\/a><a href='https:\/\/stockmarketvidya.com\/blogs\/tag\/stock-market-learning-institute\/' rel='post_tag'>stock market learning institute<\/a><a href='https:\/\/stockmarketvidya.com\/blogs\/tag\/stock-market-training-nagpur\/' rel='post_tag'>stock market training Nagpur<\/a><a href='https:\/\/stockmarketvidya.com\/blogs\/tag\/stock-market-vidya\/' rel='post_tag'>Stock Market Vidya<\/a><a href='https:\/\/stockmarketvidya.com\/blogs\/tag\/technical-analysis-course-nagpur\/' rel='post_tag'>technical analysis course Nagpur<\/a><a href='https:\/\/stockmarketvidya.com\/blogs\/tag\/trading-classes-in-nagpur\/' rel='post_tag'>trading classes in Nagpur<\/a><a href='https:\/\/stockmarketvidya.com\/blogs\/tag\/trading-psychology\/' rel='post_tag'>Trading Psychology<\/a><a href='https:\/\/stockmarketvidya.com\/blogs\/tag\/trading-strategies-course-india\/' rel='post_tag'>trading strategies course india<\/a>"},"readTime":{"min":25,"sec":5},"status":"publish","excerpt":""},{"id":895,"link":"https:\/\/stockmarketvidya.com\/blogs\/global-market-crash-or-opportunity-understanding-the-impact-of-iran-war-on-stock-markets\/","name":"global-market-crash-or-opportunity-understanding-the-impact-of-iran-war-on-stock-markets","thumbnail":{"url":"https:\/\/stockmarketvidya.com\/blogs\/wp-content\/uploads\/2026\/05\/Impact-of-Iran-war-on-Indian-market-as-well-global-market-1.png","alt":"Global Market Crash or Opportunity? Understanding the Impact of Iran War on Stock Markets"},"title":"Global Market Crash or Opportunity? Understanding the Impact of Iran War on Stock Markets","author":{"name":"Share Market Blog","link":"https:\/\/stockmarketvidya.com\/blogs\/author\/share-market-blog\/"},"date":"May 27, 2026","dateGMT":"2026-05-27 12:43:13","modifiedDate":"2026-05-28 09:40:02","modifiedDateGMT":"2026-05-28 09:40:02","commentCount":"0","commentStatus":"open","categories":{"coma":"<a href=\"https:\/\/stockmarketvidya.com\/blogs\/category\/share-market\/\" rel=\"category tag\">Share Market<\/a>","space":"<a href=\"https:\/\/stockmarketvidya.com\/blogs\/category\/share-market\/\" rel=\"category tag\">Share Market<\/a>"},"taxonomies":{"post_tag":"<a href='https:\/\/stockmarketvidya.com\/blogs\/tag\/best-share-market-classes-in-nagpur\/' rel='post_tag'>Best share market classes in Nagpur<\/a><a href='https:\/\/stockmarketvidya.com\/blogs\/tag\/crude-oil-and-indian-economy\/' rel='post_tag'>crude oil and Indian economy<\/a><a href='https:\/\/stockmarketvidya.com\/blogs\/tag\/crude-oil-price-impact\/' rel='post_tag'>crude oil price impact<\/a><a href='https:\/\/stockmarketvidya.com\/blogs\/tag\/fiis-and-indian-market\/' rel='post_tag'>FIIs and Indian market<\/a><a href='https:\/\/stockmarketvidya.com\/blogs\/tag\/futures-and-options-training-nagpur\/' rel='post_tag'>futures and options training Nagpur<\/a><a href='https:\/\/stockmarketvidya.com\/blogs\/tag\/geopolitical-tension-and-stock-market\/' rel='post_tag'>geopolitical tension and stock market<\/a><a href='https:\/\/stockmarketvidya.com\/blogs\/tag\/global-market-crash\/' rel='post_tag'>global market crash<\/a><a href='https:\/\/stockmarketvidya.com\/blogs\/tag\/gold-price-during-war\/' rel='post_tag'>gold price during war<\/a><a href='https:\/\/stockmarketvidya.com\/blogs\/tag\/indian-stock-market-news\/' rel='post_tag'>Indian stock market news<\/a><a href='https:\/\/stockmarketvidya.com\/blogs\/tag\/inflation-and-stock-market\/' rel='post_tag'>inflation and stock market<\/a><a href='https:\/\/stockmarketvidya.com\/blogs\/tag\/intraday-trading-course-nagpur\/' rel='post_tag'>intraday trading course Nagpur<\/a><a href='https:\/\/stockmarketvidya.com\/blogs\/tag\/iran-war-impact-on-stock-market\/' rel='post_tag'>Iran war impact on stock market<\/a><a href='https:\/\/stockmarketvidya.com\/blogs\/tag\/market-correction-opportunities\/' rel='post_tag'>market correction opportunities<\/a><a href='https:\/\/stockmarketvidya.com\/blogs\/tag\/nifty-market-crash\/' rel='post_tag'>Nifty market crash<\/a><a href='https:\/\/stockmarketvidya.com\/blogs\/tag\/nism-certified-trainer\/' rel='post_tag'>NISM Certified Trainer<\/a><a href='https:\/\/stockmarketvidya.com\/blogs\/tag\/option-trading-course-nagpur\/' rel='post_tag'>option trading course Nagpur<\/a><a href='https:\/\/stockmarketvidya.com\/blogs\/tag\/prashant-sarode\/' rel='post_tag'>Prashant Sarode<\/a><a href='https:\/\/stockmarketvidya.com\/blogs\/tag\/risk-management-in-trading\/' rel='post_tag'>risk management in trading<\/a><a href='https:\/\/stockmarketvidya.com\/blogs\/tag\/safe-haven-gold-investment\/' rel='post_tag'>safe haven gold investment<\/a><a href='https:\/\/stockmarketvidya.com\/blogs\/tag\/sensex-today\/' rel='post_tag'>Sensex today<\/a><a href='https:\/\/stockmarketvidya.com\/blogs\/tag\/share-market-classes-nagpur\/' rel='post_tag'>share market classes Nagpur<\/a><a href='https:\/\/stockmarketvidya.com\/blogs\/tag\/stock-market-course-in-nagpur\/' rel='post_tag'>stock market course in Nagpur<\/a><a href='https:\/\/stockmarketvidya.com\/blogs\/tag\/stock-market-education-nagpur\/' rel='post_tag'>Stock Market Education Nagpur<\/a><a href='https:\/\/stockmarketvidya.com\/blogs\/tag\/stock-market-learning-institute-nagpur\/' rel='post_tag'>stock market learning institute Nagpur<\/a><a href='https:\/\/stockmarketvidya.com\/blogs\/tag\/stock-market-training-institute-nagpur\/' rel='post_tag'>stock market training institute Nagpur<\/a><a href='https:\/\/stockmarketvidya.com\/blogs\/tag\/stock-market-vidya\/' rel='post_tag'>Stock Market Vidya<\/a><a href='https:\/\/stockmarketvidya.com\/blogs\/tag\/stock-market-volatility\/' rel='post_tag'>stock market volatility<\/a><a href='https:\/\/stockmarketvidya.com\/blogs\/tag\/technical-analysis-course-nagpur\/' rel='post_tag'>technical analysis course Nagpur<\/a><a href='https:\/\/stockmarketvidya.com\/blogs\/tag\/trading-during-market-crash\/' rel='post_tag'>trading during market crash<\/a><a href='https:\/\/stockmarketvidya.com\/blogs\/tag\/trading-psychology\/' rel='post_tag'>Trading Psychology<\/a>"},"readTime":{"min":18,"sec":58},"status":"publish","excerpt":""},{"id":888,"link":"https:\/\/stockmarketvidya.com\/blogs\/on-balance-volume-obv-understanding-the-power-of-volume-in-stock-market-trading\/","name":"on-balance-volume-obv-understanding-the-power-of-volume-in-stock-market-trading","thumbnail":{"url":"https:\/\/stockmarketvidya.com\/blogs\/wp-content\/uploads\/2026\/05\/On-Balance-Volume-OBV-1.png","alt":"On Balance Volume (OBV): Understanding the Power of Volume in Stock Market Trading"},"title":"On Balance Volume (OBV): Understanding the Power of Volume in Stock Market Trading","author":{"name":"Share Market Blog","link":"https:\/\/stockmarketvidya.com\/blogs\/author\/share-market-blog\/"},"date":"May 21, 2026","dateGMT":"2026-05-21 01:00:00","modifiedDate":"2026-05-22 10:24:46","modifiedDateGMT":"2026-05-22 10:24:46","commentCount":"0","commentStatus":"open","categories":{"coma":"<a href=\"https:\/\/stockmarketvidya.com\/blogs\/category\/share-market\/\" rel=\"category tag\">Share Market<\/a>, <a href=\"https:\/\/stockmarketvidya.com\/blogs\/category\/share-market-course\/\" rel=\"category tag\">Share Market Course<\/a>","space":"<a href=\"https:\/\/stockmarketvidya.com\/blogs\/category\/share-market\/\" rel=\"category tag\">Share Market<\/a> <a href=\"https:\/\/stockmarketvidya.com\/blogs\/category\/share-market-course\/\" rel=\"category tag\">Share Market Course<\/a>"},"taxonomies":{"post_tag":"<a href='https:\/\/stockmarketvidya.com\/blogs\/tag\/intraday-trading-india\/' rel='post_tag'>Intraday Trading India<\/a><a href='https:\/\/stockmarketvidya.com\/blogs\/tag\/on-balance-volume-indicator-obv-indicator-volume-trading-strategy-technical-analysis-stock-market-trading-obv-trading-strategy-volume-analysis-in-trading\/' rel='post_tag'>On Balance Volume Indicator OBV Indicator Volume Trading Strategy Technical Analysis Stock Market Trading OBV Trading Strategy Volume Analysis in Trading<\/a><a href='https:\/\/stockmarketvidya.com\/blogs\/tag\/price-action-trading\/' rel='post_tag'>Price Action Trading<\/a><a href='https:\/\/stockmarketvidya.com\/blogs\/tag\/share-market-classes-nagpur\/' rel='post_tag'>share market classes Nagpur<\/a><a href='https:\/\/stockmarketvidya.com\/blogs\/tag\/stock-market-course-nagpur\/' rel='post_tag'>Stock Market Course Nagpur<\/a><a href='https:\/\/stockmarketvidya.com\/blogs\/tag\/technical-analysis\/' rel='post_tag'>Technical Analysis<\/a><a href='https:\/\/stockmarketvidya.com\/blogs\/tag\/technical-indicators\/' rel='post_tag'>Technical Indicators<\/a><a href='https:\/\/stockmarketvidya.com\/blogs\/tag\/trading-institute-nagpur\/' rel='post_tag'>Trading Institute Nagpur<\/a><a href='https:\/\/stockmarketvidya.com\/blogs\/tag\/volume-analysis-in-trading\/' rel='post_tag'>Volume Analysis in Trading<\/a><a href='https:\/\/stockmarketvidya.com\/blogs\/tag\/volume-trading-strategy\/' rel='post_tag'>Volume Trading Strategy<\/a>"},"readTime":{"min":10,"sec":56},"status":"publish","excerpt":""}]